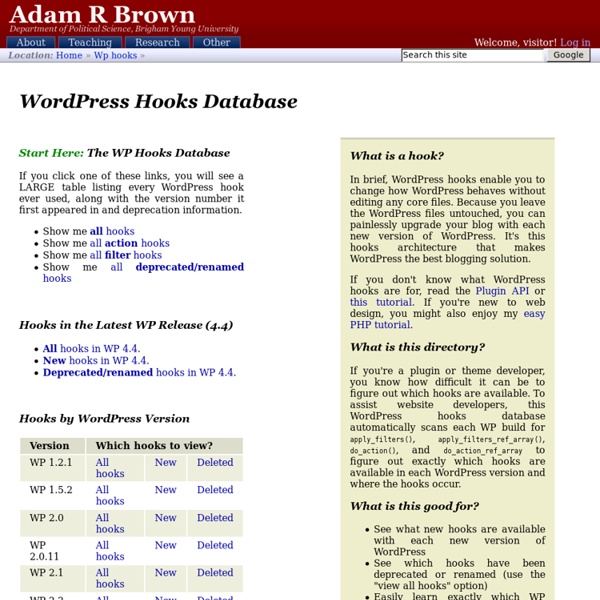
WordPress hooks database - action and filter hooks for wp plugin developers
What is a hook? In brief, WordPress hooks enable you to change how WordPress behaves without editing any core files. Because you leave the WordPress files untouched, you can painlessly upgrade your blog with each new version of WordPress. It's this hooks architecture that makes WordPress the best blogging solution. If you don't know what WordPress hooks are for, read the Plugin API or this tutorial. If you're new to web design, you might also enjoy my easy PHP tutorial. What is this directory? If you're a plugin or theme developer, you know how difficult it can be to figure out which hooks are available. What is this good for? See what new hooks are available with each new version of WordPress See which hooks have been deprecated or renamed (use the "view all hooks" option) Easily learn exactly which WP file(s) use each hook. How to help? Update and improve the official action and filter references.
http://adambrown.info/p/wp_hooks
Administration Menus
Administration Menus Languages: English • 中文(简体) • 日本語 • Русский • (Add your language) Introduction Usually, plugin and theme authors need to provide access to a settings (options) screen so users can customize how the plugin or theme is used.
Function Reference/wpdb Class
Languages: English • Italiano • 日本語 • Русский • 中文(简体) • 中文(繁體) • (Add your language) Talking to the Database: The wpdb Class WordPress defines a class called wpdb, which contains a set of functions used to interact with a database. Its primary purpose is to provide an interface with the WordPress database, but can be used to communicate with any other appropriate database.
Plugin API
Plugin API Languages: বাংলা • English • Español • Français • 日本語 • 한국어 • Português do Brasil • ไทย • 中文(简体) • Русский • (Add your language) Introduction
Creating Tables with Plugins
Creating Tables with Plugins Languages: English • 日本語 • Русский • (Add your language) If you are writing a plugin for WordPress, you will almost certainly find that you need to store some information in the WordPress database. There are two types of information you could store:
Function Reference/wp upload dir
Function Reference/wp upload dir Description Returns an array of key => value pairs containing path information on the currently configured uploads directory. Checks the 'upload_path' option, which should be from the web root folder, and if it isn't empty it will be used.
Managing Plugins
Managing Plugins Languages: English • Français • 日本語 • Português do Brasil • 中文(简体) • (Add your language) WordPress Plugins are composed of php scripts that extend the functionality of WordPress. They offer new additions to your blog that either enhance features that were already available or add otherwise unavailable new features to your site. The majority of WordPress users don't require Plugins, or only require a few, such as Plugins dealing with comment spam or customized post listings. Other users enjoy the varied options Plugins provide such as frequently updated weather reports, post word counts, rating systems, and more.
Sharing media libraries across network sites in WordPress - ChannelEaton
This is part of a larger project I’m developing at work. The ultimate goal is to have a central blog where the department can serve up sanctioned images, video, and audio for students to use on their portfolios – also hosted in the same WordPress multisite network. After realizing that a (good) solution does not yet exist, I set out to create my own. The first hurdle was to create a new tab in the Upload/Insert media page. This task was made easy by a great tutorial here .
Writing a Plugin
Languages: English • العربية • বাংলা • Español • Italiano • a Plugin 日本語 한국어 • Português do Brasil • Русский • ไทย • 中文(简体) • (Add your language) WordPress Plugins allow you to easily modify, customize, and enhance a WordPress site. Instead of changing the core program code of WordPress, you can add functionality with WordPress Plugins. Here is a basic definition. A WordPress Plugin is a program or a set of one or more functions written in the PHP scripting language, that adds a specific set of features or services to the WordPress site.
Related:


