background preloader

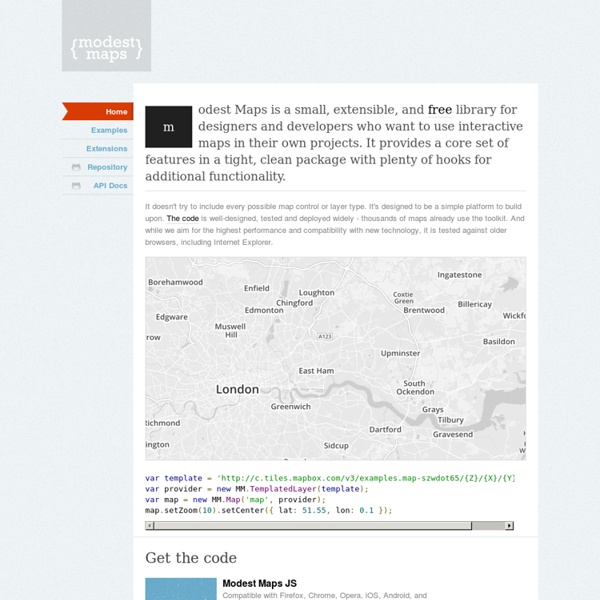
Modest Maps

Modest Maps

Tangle: a JavaScript library for reactive documents Tangle is a JavaScript library for creating reactive documents. Your readers can interactively explore possibilities, play with parameters, and see the document update immediately. Tangle is super-simple and easy to learn. This is a simple reactive document. When you eat 3 drag cookies, you consume 150 calories. This is the HTML for that example. When you eat <span data-var="cookies" class="TKAdjustableNumber"> cookies</span>, you consume <span data-var="calories"> calories</span>. And this is the JavaScript. Write your document with HTML and CSS, as you normally would. Try out some examples. Proposition 21: Vehicle License Fee for State Parks The way it is now: California has 278 state parks, including state beaches and historic parks. What Prop 21 would do: Proposes to charge car owners an extra $18 on their annual registration bill, to go into the state park fund. Analysis: Suppose that an extra $18 was charged to 100 % of California taxpayersvehicle registrations. Fc = 2 KHz Q = 0.8 Unstable

Natural Earth Kartograph.org Leaflet - a JavaScript library for mobile-friendly maps QuadTiles QuadTiles are a geo-data storage/indexing strategy - it's more commonly referred to as hierarchical binning. The idea is to store a geo-database such that data for a specific location can be retrieved quickly, by dividing the data up by location, partitioning the world into tiles. Note that we use the word tiles a lot in OpenStreetMap, and in fact we're normally talking about tiled map images, that's not really what this page is about although a QuadTile data indexing scheme has some similarities with Slippy map tilenames. Splitting the world into tiles If we split the world into 4 tiles, (level 1 of zoom) then we would need 2 bits to give a tile address (topleft, topright, bottomleft, bottomright). Each of those tiles would be about 20,000km in size. Tile size tradeoffs The smaller tiles that you have, the more bits are required to address them. Quadtile implementation A quadtile is a recursive addressing scheme for 2 dimensional space, that is particularly useful in uneven datasets.

Crossfilter Fast Multidimensional Filtering for Coordinated Views Crossfilter is a JavaScript library for exploring large multivariate datasets in the browser. Crossfilter supports extremely fast (<30ms) interaction with coordinated views, even with datasets containing a million or more records; we built it to power analytics for Square Register, allowing merchants to slice and dice their payment history fluidly. Since most interactions only involve a single dimension, and then only small adjustments are made to the filter values, incremental filtering and reducing is significantly faster than starting from scratch. Crossfilter uses sorted indexes (and a few bit-twiddling hacks) to make this possible, dramatically increasing the perfor­mance of live histograms and top-K lists. Example: Airline on-time performance The coordinated visualizations below (built with D3) show nearly a quarter-million flights from early 2001: part of the ASA Data Expo dataset. February 28, 2001 236 mi. +139 min. 304 mi. 569 mi.

Construïm Catalunya - Generalitat de Catalunya Font d’informació de les dades Els continguts i dades del cercador provenen del Sistema de Coneixement de les Actuacions al Territori (SCAT), aplicació informàtica del Departament de la Presidència, actualitzada regularment a través de les dades proveïdes pels diferents departaments i empreses públiques de la Generalitat de Catalunya. Les dades incloses en aquesta aplicació són les inversions pròpies i subvencions de capital a ens locals, per a obres territorialitzables vives (acabades, iniciades o en procés) en algun moment des de l'inici de legislatura fins a la data actual. Les dades recollides són dades d’execució contractual agregades, és a dir, que per a una mateixa obra s’han agregat tots els expedients contractuals que hi estan relacionats, per tal de formar un únic registre. No es relacionen a la base de dades (i per tant a l’aplicació) les obres a oficines administratives, encara que siguin d’atenció al públic (p.ex. les noves oficines del Servei d’Ocupació de Catalunya).

Polymaps Google Maps Utilisateurs d'un lecteur d'écran : cliquez ici pour accéder à la version HTML brut Les cookies assurent le bon fonctionnement de nos services. En utilisant ces derniers, vous acceptez l'utilisation des cookies.En savoir plusOK PlusAutres résultats Google Connexion Satellite Trafic Transports en commun Photos Relief Quitter Modifier dans Google Map MakerSignaler un problème Données cartographiques ©2014 Google - 500 m 2000 pieds France Ce n'est pas votre position actuelle ?

SettingZoomLevels – OpenLayers The OpenLayers Map is designed to display each of its layers at different levels of Scale or Resolution. The map object refers to these levels as ZoomLevels, and allows each layer to define its own ZoomLevels as it sees fit. To configure the ZoomLevels of any OpenLayers Layer, the user sets various properties in the options array on initialization. Normal Layers ¶ For normal layers which are based off of OpenLayers.Layer and are able to display at any resolution, there exist a multitude of different ways to configure the ZoomLevels and their respective scales and resolutions. Resolutions Array: To translate ZoomLevels into Resolution, a resolutions array is populated, which is a list of the different supported resolutions for the layer. Example: If the layer's resolution is [a,b,c], then ZoomLevel 0 is a, ZoomLevel 1 is b, and so on. Ways to Configure the Resolutions Array ¶ Available Options: Example Declarations: Obviously all of the configuration options listed above can not be set at once.

Raphaël—JavaScript Library

Related: