
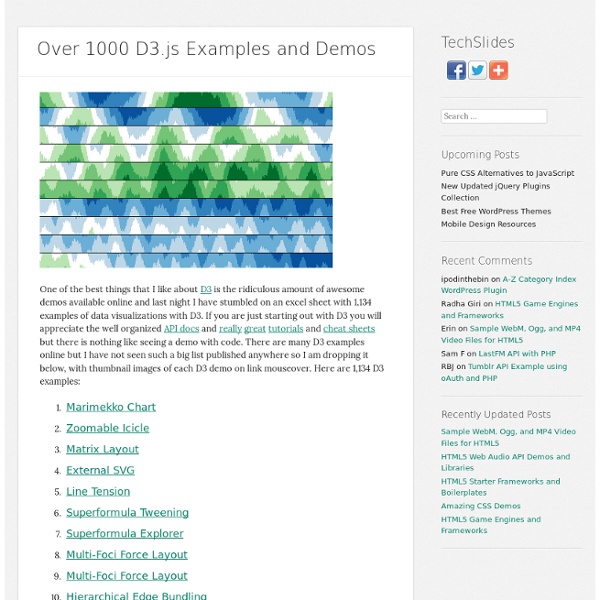
sahat/hackathon-starter Protovis Protovis composes custom views of data with simple marks such as bars and dots. Unlike low-level graphics libraries that quickly become tedious for visualization, Protovis defines marks through dynamic properties that encode data, allowing inheritance, scales and layouts to simplify construction. Protovis is free and open-source, provided under the BSD License. It uses JavaScript and SVG for web-native visualizations; no plugin required (though you will need a modern web browser)! Although programming experience is helpful, Protovis is mostly declarative and designed to be learned by example. Protovis is no longer under active development.The final release of Protovis was v3.3.1 (4.7 MB). This project was led by Mike Bostock and Jeff Heer of the Stanford Visualization Group, with significant help from Vadim Ogievetsky. Updates June 28, 2011 - Protovis is no longer under active development. September 17, 2010 - Release 3.3 is available on GitHub. May 28, 2010 - ZOMG! Getting Started
A Tour Through the Visualization Zoo Jeffrey Heer, Michael Bostock, and Vadim Ogievetsky Stanford University Introduction Thanks to advances in sensing, networking, and data management, our society is producing digital information at an astonishing rate. According to one estimate, in 2010 alone we will generate 1,200 exabytes — 60 million times the Library of Congress. Within this deluge of data lies a wealth of valuable information on how we conduct our businesses, governments, and personal lives. The goal of visualization is to aid our understanding of data by leveraging the human visual system's highly-tuned ability to see patterns, spot trends, and identify outliers. Creating a visualization requires a number of nuanced judgments. In this article, we provide a brief tour through the "visualization zoo," showcasing techniques for visualizing and interacting with diverse data sets. Each visualization is accompanied by an interactive example: click the image to load the full visualization. Time-Series Data Index Charts Maps
arbor.js The 20 best tools for data visualization | Design tools It's often said that data is the new world currency, and the web is the exchange bureau through which it's traded. As consumers, we're positively swimming in data; it's everywhere from labels on food packaging design to World Health Organisation reports. As a result, for the designer it's becoming increasingly difficult to present data in a way that stands out from the mass of competing data streams. Get Adobe Creative Cloud One of the best ways to get your message across is to use a visualization to quickly draw attention to the key messages, and by presenting data visually it's also possible to uncover surprising patterns and observations that wouldn't be apparent from looking at stats alone. As author, data journalist and information designer David McCandless said in his TED talk: "By visualizing information, we turn it into a landscape that you can explore with your eyes, a sort of information map. There are many different ways of telling a story, but everything starts with an idea.
Datavisualization.ch Twitter Bootstrap Tutorial Last update on April 14 2018 06:14:58 (UTC/GMT +8 hours) The most popular of the front end frameworks, Twitter Bootstrap, has come to its third version (v3.0.0). This Twitter Bootstrap Tutorial for beginners will get you started with Twitter Bootstrap 3. You will also see how to customize the out of the box features of the framework, using grids to creating a layout, creating navigation with nav, creating dropdowns, using carousal, adding third party staff like embedding social plugins and Google Map and more. Bootstrap Examples To provide you with Better understanding, we have explicitly compiled a good amount of Bootstrap Examples besides the ones included with the tutorials. What is twitter bootstrap Twitter Bootstrap is a front end framework to develop web apps and sites fast. Moreover, since the entire framework is module based, you can customize it with your own bit of CSS or even go for a complete overhaul after getting started. Why do you use Twitter Bootstrap in your projects? <!
API Documentation Overview The Smartsheet API provides programmatic access to Smartsheet features and data. In designing the API, our goal was to make it simple, intuitive, and predictable. RESTful Architecture Everything in Smartsheet is represented as an object with a defined structure. URL structure follows typical resource-oriented conventions. HTTP Methods and Response Codes All actions taken through the API are done via HTTP using standard HTTP methods: GET (to retrieve an object), POST (to create), PUT (to modify), and DELETE. Standard HTTP Response codes are used to indicate success and error conditions. Input/Output Format Request body data is expected to be in JSON, and the response body data is returned as JSON. Example Requests and Responses With every API method we provide a sample request and a sample response. Versioning and Changes Non-breaking changes: We will be adding new functionality and bug fixes to the API over time. Help Rate Limiting Errors Smartsheet HTTP codes: "errorCode": 1006, "rows": [