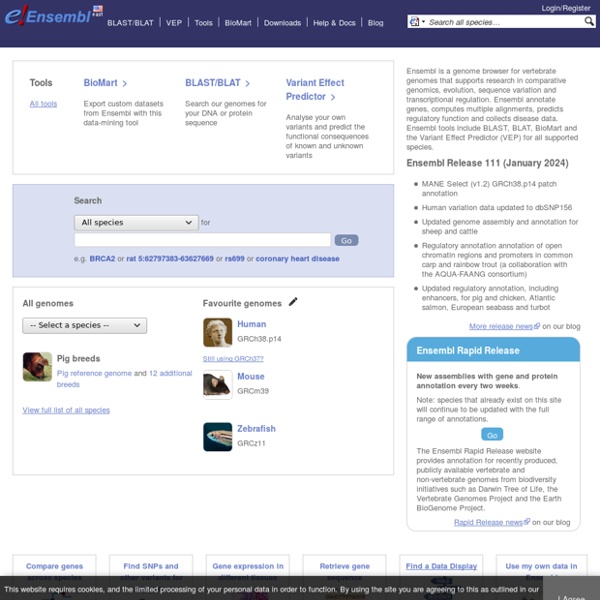


http://useast.ensembl.org/index.html
PLINK This page describes some basic file formats, convenience functions and analysis options for rare copy number variant (CNV) data. Support for common copy number polymorphisms (CNPs) is described here. Copy number variants are represented as segments. Protein Data Bank - RCSB PDB A Structural View of Biology This resource is powered by the Protein Data Bank archive-information about the 3D shapes of proteins, nucleic acids, and complex assemblies that helps students and researchers understand all aspects of biomedicine and agriculture, from protein synthesis to health and disease. As a member of the wwPDB, the RCSB PDB curates and annotates PDB data.
L'algorithme qui fait avancer la biologie L'algorithme qui fait avancer la biologie - 1 Photo Vous êtes biologiste et vous voulez savoir quel est le degré de parenté et l'histoire évolutive entre les différentes espèces de levures (ou de vers, ou d'insectes, ou d'oiseaux) que vous êtes en train d'étudier. La méthode la plus fiable, celle qui ne vous induira pas en erreur par des ressemblances morphologiques superficielles, c'est la phylogénie moléculaire : comparer le génome de vos bestioles. Pour ce faire, vous disposez désormais de banques de données regroupant des millions de séquences d'ADN correspondant à des dizaines de milliers d'espèces vivantes. Mais, sans outils adaptés pour les comparer, elles resteront une suite muette de A, T, C et G.
ASHG 2010: 1000 Genomes Project Tutorials ASHG 2010: 1000 Genomes Project Tutorial Videos The 1000 Genomes Project has released the data sets for the pilot projects and for more than 1000 samples for the full-scale project. A tutorial for how to use the data was held at the 2010 American Society of Human Genetics (ASHG) annual convention on November 3. Videos for each of the tutorial sessions are now available. Tree of Life Web Project The Tree of Life Web Project (ToL) is a collaborative effort of biologists and nature enthusiasts from around the world. On more than 10,000 World Wide Web pages, the project provides information about biodiversity, the characteristics of different groups of organisms, and their evolutionary history (phylogeny). Each page contains information about a particular group, e.g., salamanders, segmented worms, phlox flowers, tyrannosaurs, euglenids, Heliconius butterflies, club fungi, or the vampire squid. ToL pages are linked one to another hierarchically, in the form of the evolutionary tree of life.
PennCNV PennCNV: copy number variation detection Welcome! PennCNV is a free software tool for Copy Number Variation (CNV) detection from SNP genotyping arrays. BioNumbers - The Database of Useful Biological Numbers CHGV (Duke University) SIFT