
Two degrees? Sounds nice. The reality will be rather different If we continue to emit ever-greater quantities of CO2 and other greenhouse gases into the atmosphere, then average global temperatures will rise by 2°C over the next three decades compared to pre-industrial times. Most scientists agree that anything higher is dangerous, though many argue that even this is too much. As the battles to reach an agreement in Paris begin, and with so much at stake, it is perhaps curious that few people really understand what a 2°C rise in average temperatures will mean. When our climate changes so much from day to day, an increase of this seemingly small magnitude appears almost trivial. But it is not. Rather than thinking about how much nicer it will be to have summers that are 2°C warmer, we should think about the planet more like we think about our bodies. The average temperature of the planet today is around 15°C, one degree more than it was in 1750. The warming of the world may also change our values.
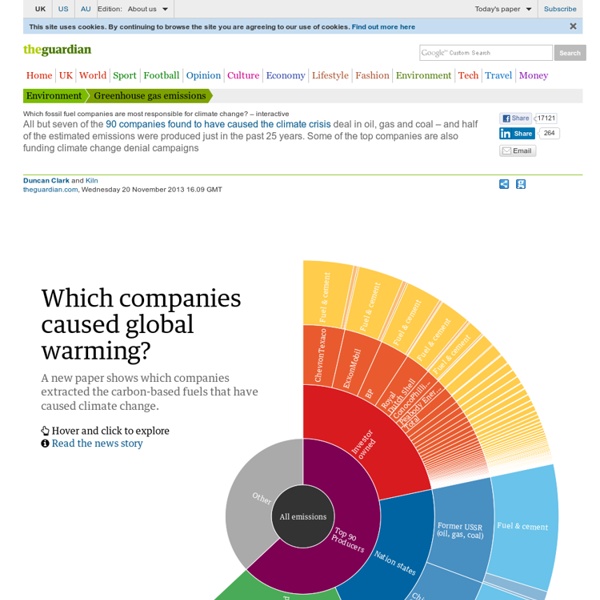
90 entreprises sont responsables de deux tiers des émissions mondiales de gaz à effet de serre Une étude pointe les 90 entreprises qui ont produit le plus de gaz à effet de serre. Les pétroliers Chevron, ExxonMobil, BP et Shell arrivent en tête. Parmi les groupes français, Total et le cimentier Lafarge sont les entreprises qui contribuent le plus aux émissions de CO2 et de méthane. Deux tiers des émissions mondiales de gaz à effet de serre accumulées dans l’atmosphère depuis le début de la révolution industrielle sont causées par seulement... 90 entreprises ! Les cinq premières entreprises privées sont les géants pétroliers américains Chevron (3,5 % des émissions) et ExxonMobil (3,2 %), la britannique BP (2,4 %), la néerlandaise Shell (2,1 %) et l’entreprise américaine ConocoPhillips (1,1 %). Quelles sont les compagnies qui provoquent le réchauffement climatique ? Sophie Chapelle Photo : CC Graeme Maclean
Le Co-Lab | Coopération, co-opétition, collaboration, co-opportunité, économie collaborative, co-management, Co-Révolution… KesaCO? Zementindustrie verursacht sechs Prozent Dienstag, 26. Januar 2016, 08:06 Uhr 17 Millionen Tonnen pro Jahr – das ist die Treibhausgasfracht, mit der die Zementindustrie in Deutschland jährlich die Erde aufheizt. Weltweit trägt die Branche mit sechs Prozent zum menschengemachten Klimawandel bei: Das Institut für Feuerungs- und Kraftwerkstechnik (IFK) der Universität Stuttgart startete jetzt das Projekt "CEMCAP", mit dem Abscheide- und Speichertechnologien erprobt werden sollen, die den Treibhausgas-Ausstoß der Zementindustrie eindämmen. Denn bei der Zementproduktion lässt sich die Entstehung von Kohlendioxid nach übereinstimmender Expertenmeinung nicht vermeiden. Sehr viel Zement auf einem Haufen: Downtown Manhattan. Nur etwa ein Drittel der Treibhausgas-Emissionen durch die Zementherstellung entfällt auf die Energiebereitstellung aus meist fossilen Brennstoffen, etwa um ausreichend hohe Temperaturen für die Zementklinker-Produktion zu gewährleisten. klimaretter.info/reni
Land Use Decisions Impact Forest Benefits A new study by Harvard University's Harvard Forest and the Smithsonian Institution reveals that, if left unchecked, recent trends in the loss of forests to development will undermine significant land conservation gains in Massachusetts, jeopardize water quality and limit the natural landscape's ability to protect against climate change. Scientists researched and analyzed four plausible scenarios for what Massachusetts could look like in the future. The scenarios were developed by a group of forestry professionals, land-use planning and water policy experts, and conservation groups. The scenarios reflect contrasting patterns and intensities of land development, wood harvesting, conservation and agriculture. The two-year study entitled "Changes to the Land" is distinctive in its forward-looking approach and its use of sophisticated computer models to conduct a detailed acre-by-acre analysis of the entire forested landscape of Massachusetts over 50 years. Continue reading at ecoRI News.
Ask Nature - the Biomimicry Design Portal: biomimetics, architecture, biology, innovation inspired by nature, industrial design - Ask Nature - the Biomimicry Design Portal: biomimetics, architecture, biology, innovation inspired by nature, industrial desi About CO2 emissions from the cement industry constitute 5% (or 1.9 Gt annually) of global anthropogenic CO2 emissions[1]. In 2013, approximately 20% of global CO2 emissions from cement production originated from Europe (EU28)[2]. Given the ambitious energy and climate targets that the EU has proposed and agreed on (40% emissions reduction by 2030[3], 80-95% emissions reduction by 2050), CO2 emissions from energy-intensive industries will need to be eliminated or significantly reduced. CO2 generation is an inherent part of the cement production process, due to the calcination of the most important raw material, limestone (CaCO3 converted to CaO and CO2): about 60 % of the CO2 emissions from cement production are due to this conversion, whereas 40% come from the burning of fuels (which are to a large extent fossil) to provide heat for the clinker production. As the first project within the EU Framework Programs, CEMCAP thus focuses on the challenge of capturing CO2 from cement plants.
Ozone layer will take five more decades to fully recover Remember when the world came together to save the ozone layer — even Ronald Reagan and Margaret Thatcher? The Montreal Protocol, a treaty that went into effect in 1989, curbed the use of CFCs and other chemicals that tear up the planet’s UV-absorbing sheath of ozone. But that was nearly a generation ago — and things still haven’t been fully patched up in the lower stratosphere. The ongoing fragility of the ozone layer reminds us how long it can take for atmospheric conditions to stabilize after we have screwed them up. In 2006, the ozone hole grew larger than ever. Prognosis for a full recovery? It’s worth remembering that the chemicals that destroyed the ozone layer can persist in the atmosphere for decades.
Knowledge Cafe A knowledge café or World Café is a type of business meeting or organisational workshop which aims to provide an open and creative conversation on a topic of mutual interest to surface their collective knowledge, share ideas and insights, and gain a deeper understanding of the subject and the issues involved. Origins[edit] Small group conversation at a Gurteen Knowledge Cafe The knowledge café method has multiple origins with links to other related methods such as The World Cafe. Elizabeth Lank developed the concept creating a physical and mobile cafe area in the 1990s. Gurteen process and recommendations[edit] The knowledge café begins with the participants seated in a circle of chairs (or concentric circles of chairs if the group is large or the room is small). When the introduction session is complete, the group breaks into small groups, with about five people in each group. A knowledge café is most effective with between 15 and 50 participants. Related methods[edit] See also[edit]
Exclusive: Climate Hustle’s Marc Morano Turns Down $20k Global Warming Bets From Bill Nye The Science Guy One of America’s most outspoken deniers of the link between fossil fuel burning and global warming has refused $20,000 in bets that the planet will keep getting hotter. Offering the two bets to Marc Morano, of the conservative think tank the Committee for a Constructive Tomorrow (CFACT), is popular television science presenter Bill Nye, “the science guy”. Nye said he was willing to bet Morano that 2016 would be one of the ten hottest years on record. He also offered a bet the current decade would be the hottest on record. As DeSmog has reported, Climate Hustle features a roll call of climate science deniers and is set to rehash old myths. Showbusiness “bible” Variety magazine reported as an “exclusive” today that former Alaska Governor Sarah Palin was endorsing the movie - an “exclusive” based on a press release from 31 March. Nye said he had only been shown clips of the film, which will be distributed by Fathom Events. Morano told DeSmog: “I did turn down Nye's temperature bets.
Compte rendu video du Petit-déjeuner / débats Comment s'adapter aux changements climatiques ? Comment s’adapter aux changements climatiques ? Entre connaissance et mise en œuvre : dynamiques d’acteurs en Midi-Pyrénées Le mardi 26 novembre, 9h à 11h au Centre international de Conférence de Météo-France, Toulouse Télécharger le document « Repères » remis aux participants ( Pdf, 637 Ko ) Le Groupe intergouvernemental d’experts sur l’évolution du climat (GIEC) vient de publier son 5ème rapport où il assure que « l’influence de l’homme sur le système climatique est claire. Cela est manifeste dans la plupart des régions du globe. » En Midi-Pyrénées, le Schéma Régional Climat Air Energie piloté par l’Etat et la Région a été élaboré en concertation avec de nombreux acteurs. Comment s’adapter aux changements climatiques aujourd’hui en Midi-Pyrénées ? Pour répondre à ces questionnements, les experts en présence : Mot d’accueil par Dominique ANDRE, directeur adjoint la Production de Météo-France Du GIEC à Météo-FrancePhilippe DANDIN, directeur de la climatologie à Météo-France Terra memoria (12)
Movilab.org Liste des contributeurs Cette présentation a été conçu en juillet 2018 pour la formation facilitateur de Tiers Lieux de Bordeaux, décliné pour les rencontres du réseau Relier à Lodève et amélioré pour l'université du Le Wip "lieux infinis" à Venise. Vous êtes donc libre de l'utiliser, l'étudier, la modifier et la (re)diffuser #Concierge QR Code : avec un lecteur de QR Code sur votre smartphone ou tablette, vous pouvez visualiser des documents et des vidéo dans certaines slides. Ce n'est pas encore de la réalité augmentée mais ça vous permet d'aller plus loin sans vous déplacer... "On a pas pris la Bastille pour en faire un opéra !" Citation de Pierre Desproges Toutes les formes de documentations sur la page Arbre des documentations Cette page permet de comprendre par la pratique la documentation d'actions remarquables pour leur participation à des modes de vie et de production durables sous la forme de " code source ". Partagez en open source le code social de vos projets libres
CO₂ zählen ist kein Klimaschutz Sonntag, 08. Mai 2016, 10:01 Uhr Unter Klimaschutz wird heute meist das Einsparen einer bestimmten Menge CO2-Äquivalent verstanden. Das ist eine simplifizierende Sichtweise, die zu einem bedenklichen Ablasshandel führt. Notwendige Änderungen am ökonomischen System werden so verschleppt. Ein Standpunkt von Camila Moreno, Lili Fuhr und Daniel Speich Chassé In den letzten zehn Jahren sind CO2-Emissionen praktisch zu einem Synonym für den Klimawandel, ja für Umweltzerstörung schlechthin geworden. Der starre Blick der globalen Umweltpolitik auf CO2 spiegelt eine allgemeine Besessenheit von Messungen und Buchhaltung wider. Indem wir uns auf sie verlassen, neigen wir dazu, die historischen Auswirkungen jeder dieser Abstraktionen zu übersehen – und auch die Dynamik der Macht und Politik, die sie weiterhin formen. Warnendes Beispiel: Das Bruttoinlandsprodukt Drei entscheidende Fehler Neue Märkte für "Ökosystemdienstleistungen" Räume für das Wachsen von Alternativen Übersetzung: Jan Doolan