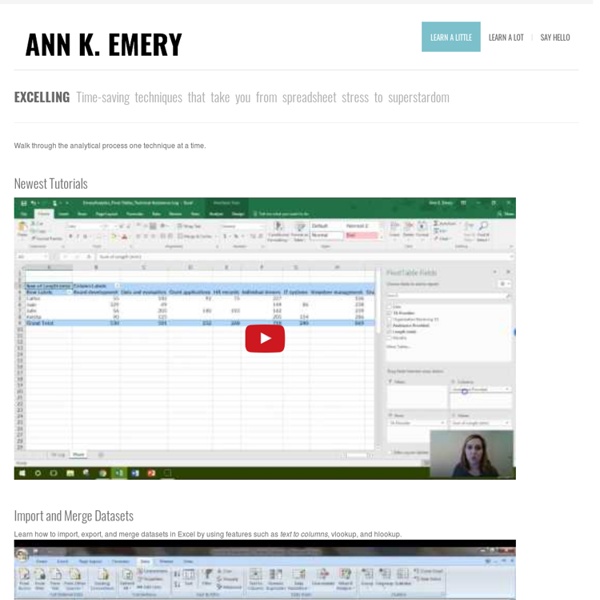
ExcelUser Home Page
AEA365
Hello, my name is Jayne Corso and I am the Community Manager for AEA. As a community manager, I create weekly posts for AEA’s Facebook and Twitter pages. Although you can share similar content on Facebook and Twitter, your approach should be unique for each channel. I have put together a few tips for composing text for both Facebook and Twitter. Facebook: Hot Tip: Keep it to 80 characters The Facebook character limit is technically 63,206; however, when posting on Facebook, you should try to keep your text within 80 characters. Hot Tip: Don’t just post a link Facebook is a great channel for sharing blog posts or linking to external content, but don’t just post the link. Hot Tip: Use images Facebook posts that use images receive more engagement than posts without images. Twitter: Hot Tip: Keep it simple Twitter has a character limit of 140, but studies have shown that posts that are 120-130 in length receive better engagement. Hot Tip: Grammar is still important Good luck crafting your posts!
*Circos | Visualization of Relationship Data
Before uploading a data file, check the samples gallery to make sure that your data format is compatible. File must be plain text. Data values must be non-negative integers. If you do not adhere to these rules, expect errors. Need help? If you are using the size, order or color options below, make sure your input file has the appropriate content (see samples 5-9). If you'd like to edit the image (e.g. arrange labels, change specific colors, etc) use the SVG file, which is provided in the download link once the image is created. Don't have a data file? Some images can take a while to make &mdsah; be patient. Current load is 0/2. Do not use this tool on confidential or sensitive information (use the offline tableviewer which has a tutorial). 27.sep.22 You can now request an access code to visualize larger tables. 16.aug.22 Updated Max row/col logic. 9.oct.15 Updated to use Circos 0.68. 7.sep.12 Updated to use Circos 0.63. 12.mar.12 Updated sample images. 7.mar.12 Fixed cookie bugs.
*Sankeymatic | Free Sankey Diagrams
<svg id="sankey_svg" height="600" width="600" xmlns=" version="1.1"><title>Your Diagram Title</title><! Copy the code above to embed your diagram. Save it in a “.svg” file to edit it in another application. Every Flow will have a tooltip when hovering.
How to Create an Excel Dashboard - The Excel Charts Blog The Excel Charts Blog
Excel dashboards and executive reports are powerful, fairly easy to design and a great way to improve your Excel and data visualization skills. Because of its flexibility, you can virtually design any dashboard in Excel exactly the way you, or the users, imagined. And, best of all, you may want to implement it yourself or consider it a prototype and ask IT to implement it. Once you know what will the Excel dashboard be used for and what kind of metrics users expect, there are three major areas that you must address when creating it: how to bring data into your spreadsheets;how to manage the data and link it to the dashboard objects, like charts and tables;how to design the dashboard report. Let’s take a look at each of them. How to bring data into your Excel dashboard Yes, Excel is a very flexible tool, but to create an Excel dashboard you can’t just paste some data and add a few charts, can you? Usually, the data should not be entered directly into the spreadsheet. Named Ranges Macros
Each Little Spark | I am a writer who hasn't yet figured out exactly what I want to say. This is my practice space.
1ere Partie - homme-et-catastrophes jimdo page!
" C'est une triste chose de penser que la nature parle et que le genre humain n'écoute pas " Victor Hugo Une catastrophe naturelle ne dépend pas de l'intervention de l'homme. Elle résulte de variations exceptionnelles de certaines conditions environnementales. Il existe trois grands types de catastrophes naturelles : les catastrophes climatiques, telles que la sécheresse ou les tempêtes; les catastrophes biologiques, telles que les disparitions des especes et les catastrophes telluriques tels que les volcans. Chacune de ses catastrophes est donc intensifiée au fil du temps par l'homme et devient de plus en plus dévastatrice. On distingue plusieurs types de catastrophes naturelles qui ont aussi chacune des origines différentes. a) Leurs origines Les catastrophes naturelles sont regroupées en trois groupes (climatique, biologique et tellurique). Les catastrophes d'origines climatiques rassemblent les inondations, les sécheresses, les cyclones, les tornades ainsi que les crises climatiques.
5 Ways Your Brain Tricks You into Sticking With Bad Habits
Bad habits can ruin your life. Whether you're gorging on Haagen-Dazs or dressing up like a Power Ranger and flaying hobos every night, you know on some level that things have to change, or disaster will follow. But no matter how badly you want your life to be different, things just keep plowing on the way they are. Why? Because your brain has a long list of diabolical mechanisms intended to keep your habits exactly as they are. #5. Getty You knew you had to be up at 7 a.m. for a big exam. Getty"Can't miss the rest of this movie. Well, don't feel so bad. Brain scans have shown that different parts of our brain light up when we're thinking of ourselves versus when we're thinking of other people. Getty"Future Bill can worry about AIDS tests. In other words, if someone asks you to think about what you'll look like in 20 years, your brain treats it as though you're trying to picture some bizarre stranger. #4. Getty"OhmygodthatwassodeliciousandcrispyandfluffyokImgonnagorunbebackinaminute!" #3.


