
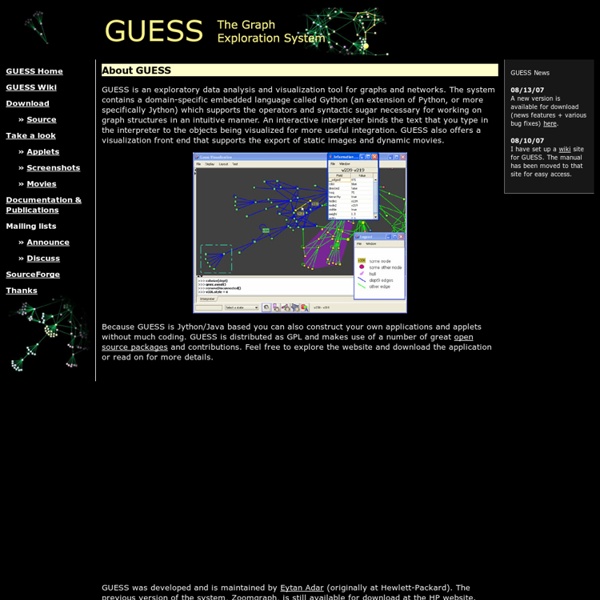
Quelques outils pour visualiser les réseaux sociaux L’analyse des réseaux sociaux permet de mieux comprendre le comportement des acteurs et des communautés : quelle est la place de l’acteur au sein de l’ensemble ? Est-il central ? périphérique ? Fait-il le lien entre différentes communautés ? Cette analyse permet de comprendre en profondeur le fonctionnement des communautés en ligne. L’analyse des réseaux sociaux se fait en trois temps distincts : la récupération des données, leur analyse et leur visualisation. Sur de petits graphes, il est possible de faire la récupération des données a la main. Les données qui sont récupérées concernent le lien : qui est lié à qui ou à quoi, mais on pourra également s’intéresser au volume d’information produits, à sa fréquence et faire quelques corrélations. Navicrawler est une extension Firefox qui explore le contenu et la structure des pages web. Navicrawler n’assurant que la récolte des données, leur traitement doit se faire avec un autre programme : Pajek, Guess, Network Workbench Tool, ou NodeXL.
GitHub - airbnb/caravel: Caravel is a data exploration platform designed to be visual, intuitive, and interactive Data Visualization and Infographics Resources - Smashing Magazine Advertisement Data visualizations and infographics can make complex datasets easier to understand and comprehend. By creating a graphical represenatation of data and statistics, complicated concepts and information can make more sense in less time. Many visualizations focus on representing a specific set of data or statistical information. But visualizations and infographics can be used poorly, too. Also consider our previous articles: Data Visualizations and Infographics which lists examples and types of infographics and data visualizations.Data Visualization: Modern Approaches showcases modern examples of data visualization and infographics. 1. Here are some blogs and website that provide great information for information designers, including how-to articles, visualization showcases and galleries, and other resources. Strange Maps Strange Maps features only map-based graphics, both modern and historical. Wall Stats Visual Complexity Cool Infographics Data Mining Edward Tufte Infographics News
NodeXL: Network Overview, Discovery and Exploration for Excel - Home Blog Le dessous des "labs" Billet publié par Stéphane Vincent Vous en avez assez des "labs" ? Difficile de vous le reprocher... Sur les dizaines d’annonces régulières de nouveaux laboratoires d’innovation (sociale, numérique, administrative, qu’ils soient d’initiative privée ou publique), combien relèvent d’un "me-too marketing" désastreux qui contribue à dévaluer un concept pourtant fertile ? Labs2, une initiative de Kennisland C’est pourquoi la rencontre Labs2 initiée les 24 et 25 avril dernier à Amsterdam par le think-tank hollandais Kennisland et l’organisme de coopération Hivos venait à point nommé. Impossible de rapporter ici toutes les idées et tous les belles rencontres occasionnées par ces deux journées, alors revenons sur ce qui nous a semblé le plus marquant. Des méthodes comparables Peu ou prou, tous les labs recourent aux sciences sociales et aux pratiques ethnographiques, au design de service ou au design thinking, et aux technologies -ou en tout cas, aspirent à le faire.
Gephi, an open source graph visualization and manipulation software Claude BOURGUIGNON Microbiologiste des Sols - Agricultiver En tant que spécialiste de la vie des sols, pouvez-vous estimer le pourcentage des sols de France atteints par la pollution (et dans quelle proportion) ? – Claude Bourguignon : 10% des sols sont pollués par des métaux lourds. 60% sont frappés d’érosion. 90% ont une activité biologique trop faible et en particulier un taux de champignons trop bas. Idem dans le monde. De plus le phénomène de fatigue des sols (chute de rendements) se fait sentir en maraîchage et en culture betteravière. Qu’est-ce que c’est pour vous, un sol ? – C. Sur trente centimêtres d’épaisseur, le sol héberge 8O % de la biomasse vivante du globe. – C’est le moment où vos ennuis commencent avec l’Inra ? – Claude Bourguignon : Exactement. Quelle a été votre démarche au début de vos recherches ? – Claude Bourguignon : J’ai essayé de comprendre pourquoi certains sols étaient plus vivants que d’autres. Quelle est votre vision du rapport de l’homme à la terre, et à l’agriculture ? Le sol est une matière vivante. Bon.
Navicrawler | WebAtlas UPDATE: There now a portable version of Firefox with Navicrawler included: More information on these: These folders are zipped. Regular versions: You can download the Navicrawler 1.7 or the Navicrawler 1.8b (now hosted directly on WebAtlas.fr). The Navicrawler is no longer supported. In this “next generation Navicrawler” you will be able to dynamically change the boundaries of every website, to have graphs with pages and websites at the same time, and to declare aliases (the same website with different domain names). Until then, the most reliable way to use the Navicrawler is probably to install Firefox 3.6 and the Navicrawler 1.7 (you might be able to install both versions of Firefox, the old one for the Navicrawler and the last one for you). Documentation (in French): The version 1.8 (and above) use a toolbar button to launch the sidebar. Right-click on the “Home” button in the menuChoose “customize” (“Personnaliser” in French)In the end of the list, there is a “Navicrawler” icon.
Creative droplets | Michael Chaize's blog about the Adobe Creative Cloud OutWit, l'outil indispensable pour les recruteurs / sourceurs Je connais Michel Sarfati depuis 2010 et ma rencontre avec lui au premier #TruLondon… Nous étions les 2 seuls français présents à l’évènement. Depuis ce fameux #TruLondon, Michel a énormément réfléchi aux questions liées au sourcing et comment avec des outils améliorer les requêtes de recherche mais aussi automatiser le recueil d’informations. Dans cet entretien, Michel nous présente un outil très populaire aux Etats-Unis, OutWit, mais créé par un français (c’est mon cocorico !) qui aide considérablement les professionnels du recrutement. Le plus impressionnant avec cet outil est sa capacité à labourer le web et à accumuler et classer n’importe quel contenu... Bonjour Michel, qui es-tu ? Je suis de formation Ingénieur (Centrale Paris 1988), et ai comme passion et spécialité l’informatique, depuis …. Je débute ma carrière en 1989 chez ACCENTURE où j’interviens en responsabilités croissantes sur d’importants projets de conseil et d’intégration de Systèmes d’information. Merci Michel !
2 Septembre : Rencontre avec Chris DiBona - Paris Android User Group (Paris September 2, 2013 · 6:00 PM Pour cette rentrée et après le magnifique apéro-conf il y a un peu moins d'un mois, nous avons le plaisir de recevoir de nouveau un Googler et pas des moindres ! C'est en effet Chris DiBona qui viendra nous rendre visite. Pour ceux qui ne connaissent pas ce monsieur, sachez qu'il est le directeur de l'Open Source chez Google, oui oui, vous avez bien entendu :-) Le sujet n’étant pas spécifiquement lie a Android, le GDG Paris se joint a nous sur l'organisation de l’événement. Chris partagera avec nous ses vues sur les récentes évolutions dans le domaine de l’Open Source et reviendra notamment sur la manière dont cela est développé du côté de Google (motivations, infrastructure, release, …) et en particulier au travers de divers projets (Summer of Code, Code-In, Android, …). Son petit talk sera suivi d'une session de questions/réponses pendant laquelle vous pourrez lui poser toutes vos questions. Edit: Nous aurons un deuxieme invite ce soir la : Michael Chaize ! /!
Épisodes Vous voulez connaître les habitudes des usagers de téléphonie mobile ? Big Data. Vous voulez rejoindre une clientèle ciblée sur le Web? Big Data. 2015 est l’année du Big Data. Des méga-croisements de données Des analyses statistiques, il y en a toujours eu. Aujourd’hui, on les produit par quintillions ces données. Pourtant, la véritable révolution du Big Data, ce n’est pas tant une question de grandeur que la manière dont on peut désormais croiser ces données. Catégoriser pour mieux régner Pour y voir clair dans ce fouillis d’informations, les algorithmes identifient des répétitions ou des modèles dans de larges segments de la population. Pour que les algorithmes fonctionnent adéquatement, il faut classer les individus dans des catégories toujours plus précises. Prédictions et discriminations Comme le rappelle Kate Crawford, interviewée dans l’épisode 05, ce sont les minorités et les populations déjà discriminées qui sont les plus affectées par les erreurs de prédictions. Faites le test