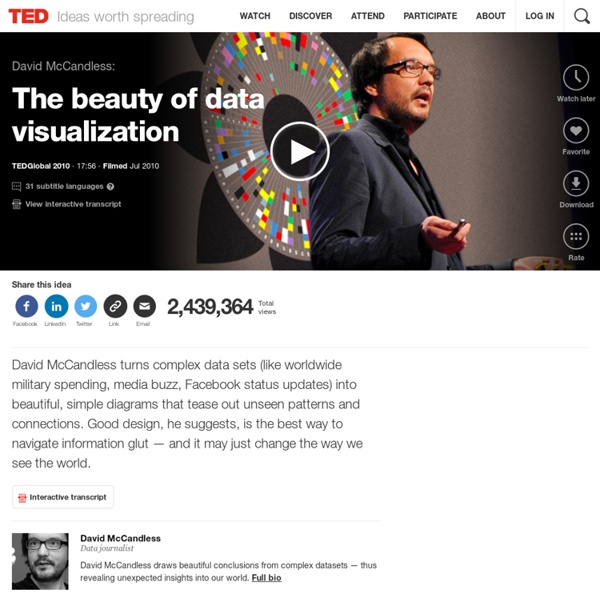


http://www.ted.com/talks/david_mccandless_the_beauty_of_data_visualization
Related: 7C Idea Resources 2016WCBM Partnership Program Home ... Partnership Program Since 2004, the Wisconsin Department of Natural Resources and the Wisconsin Citizen-based Monitoring Network have sought to expand citizen and volunteer participation in natural resource monitoring. $100,000 of Partnership Program funding will be available for the 2017 state fiscal year (July 1, 2016 to June 20, 2017). How does the thyroid manage your metabolism? - Emma Bryce For such a tiny organ that looks a lot like a butterfly, the thyroid gets a lot of attention. But it makes sense when you consider just how vital its task is: this gland helps to control the body's metabolism. If you're stuck trying to grasp why that's important and what exactly metabolism is, check out this helpful video, and read more about the thyroid's role here and here. The tools your thyroid uses to get the job done are triiodothyronine (T3) (that's a tricky word: learn how to say it!) and thyroxine (T4), the two hormones that act as messengers to all your body's cells.
Citizen-based Monitoring Partnership Program Since 2004, the Wisconsin Department of Natural Resources and Wisconsin's "Citizen-Based Monitoring Partnership Program" have sought to expand citizen and volunteer participation in natural resource monitoring by providing funding and assistance with high priority projects. Qualifying topics include monitoring of aquatic and terrestrial species, natural communities, and environmental components such as water, soil and air. Who can apply Individuals, businesses, non-profit organizations, tribal organizations or governments, local and county governments, academic institutions or state agencies which are registered in the Wisconsin State Vendor File may apply. Wisconsin DNR employees may apply if they are partnered with external, eligible individuals or organizations. Eligibility
sans titre Ready to level up your working knowledge of math? Here’s what to read now — and next. Math 101, with Jennifer Ouellette First, start with these 5 books… 1. Number: The Language of Science Tobias Dantzig Plume, 2007 Technology Programs – Upham Woods Outdoor Learning Center Program Overview and Goals The Digital Observation Technology Skills (DOTS) program is an outdoor environmental education lesson that uses modern mobile technology tools to connect today’s students to the outdoors in new and innovative ways. This inquiry-based lesson navigates the basics of the scientific method and focuses on the importance of good scientific communication and sharing discoveries with others. Students work in groups to test simple hypotheses from the environmental and ecological differences across the local landscape using data and observations collected in the field.
A Melting Arctic And Weird Weather: The Plot Thickens Everyone loves to talk about the weather, and this winter Mother Nature has served up a feast to chew on. Few parts of the US have been spared her wrath. Severe drought and abnormally warm conditions continue in the west, with the first-ever rain-free January in San Francisco; bitter cold hangs tough over the upper Midwest and Northeast; and New England is being buried by a seemingly endless string of snowy nor’easters. Yes, droughts, cold and snowstorms have happened before, but the persistence of this pattern over North America is starting to raise eyebrows. Is climate change at work here?
Home and School Systems Nelson and Pade, Inc.®’s Home Food Production systems use the same science-based design, component ratios and water flow dynamics as our commercial systems. They are just smaller. Our Home Food Production systems are a great way to learn the concepts and daily operation of aquaponics, while growing fresh fish and vegetables for your family. The individual filter tanks demonstrate all of the scientific principles of aquaponics, make operation easier and increase productivity. The multi fish tank design allows you to sequentially stock fish of the same size in each tank, resulting in regular harvests of fish and continuous harvests of vegetables. Our Clear Flow Aquaponic Systems® provide lots of fish and veggies for home food production, education and demonstration applications.
Einstein Vs Quantum Mechanics ... And Why He’d Be A Convert Today Albert Einstein may be most famous for his mass-energy equivalence formula E = mc2, but his work also laid down the foundation for modern quantum mechanics. His analysis of the “spookiness” of quantum mechanics opened up a whole range of applications including quantum teleportation and quantum cryptography, but he wasn’t completely convinced by the theory of quantum mechanics – and that story is as fascinating as the theory he attempted to nail down. Quantum mechanics is downright bizarre. It implies that a particle, such as an electron, can pass through two holes at the same time. More famously, German physicist Erwin Schrödinger’s equations proved that a cat could end up in a peculiar sort of quantum state, being neither dead nor alive. None of this impressed Einstein.
Smithsonian Science What happens when ocean currents and air masses interact? Find out in Weather Lab! Take on the role of a meteorologist by predicting spring weather and how people should dress for it in particular regions of the United States. Weather Lab is a tool to help visualize how North America’s weather is formed. This lab is designed to model the complex interactions between air masses and ocean currents, but like all models it represents probable outcomes.