
Hypercities Esri Data & Maps ArcGIS ArcGIS Sign In Sign Out Esri Data & Maps ●Share This group provides access to data layers from the Esri Data and Maps DVD set that you can download for use with your ArcGIS software. FacebookTwitter Group Content All Results Maps Layers Scenes Apps Tools Files Show ArcGIS Desktop Content TitleOwnerRatingViewsDate Details Details Earth at NightThis layer presents a nighttime view of the Earth showing the locations of permanent lights on the Earth's surface. Layer Package by esri Last Modified: January 17, 2012 (1 rating, 0 comments, 3,586 downloads) Europe Gross Domestic Product by CountryThis layer represents the 2013 Gross Domestic Product, in millions of Euros, for the countries of Europe. Layer Package by esri_dm Last Modified: February 5, 2015 (2 ratings, 3 comments, 2,252 downloads) Europe Population by Age RangeThis layer represents the percentage of people of various age ranges for the NUTS3 geographical unit in 2013. (2 ratings, 2 comments, 2,335 downloads) (2 ratings, 5 comments, 3,362 downloads)
World Streets : The New Mobility Agenda | 2012 Q1 : Brainstorming the Surprising Future of Equity-based Transport designboom: about the hand drawn map assoc. aug 04, 2008 the hand drawn map association pilsen, czech republic by yumi janairo roth (with casey mcguire and andrew blackstock), 2007 the hand drawn map association has a goal – ‘to share the maps you have found or created with the widest audience possible.’ pilsen, czech republic by yumi janairo roth (with casey mcguire and andrew blackstock), 2007 stars over pennsylvania by harriet hacker , 2007 map to new home in eindhoven, netherlands by jeff werner, 2008 jersey city, new jersey, USA by josef reyes, 2008 booklyn, new york, USA by chad mullen more the hand drawn map association: — via coudal related new map art by chris kennyNYC subway diagram 2008 by massimo vignelli for men’s vogueprintable subway maps andy butler I designboom
Derek Watkins Fusion Tables - Gather, visualize, and share data tables online Bust your data out of its silo! Get more from data with Fusion Tables. Fusion Tables is an experimental data visualization web application to gather, visualize, and share data tables. Visualize bigger table data online Filter and summarize across hundreds of thousands of rows. Two tables are better than one! Merge two or three tables to generate a single visualization that includes both sets of data. Make a map in minutes Host data online - and stay in control Viewers located anywhere can produce charts or maps from it. Visualize bigger table data online Import your own data Upload data tables from spreadsheets or CSV files, even KML. Visualize it instantly See the data on a map or as a chart immediately. Publish your visualization on other web properties Now that you've got that nice map or chart of your data, you can embed it in a web page or blog post. See how journalists and nonprofits around the world use Fusion Tables Two tables are better than one! Make a map in minutes Share that map!
Import info to your map - My Maps Help You can pull lots of geographical info into a map all at once. Here's how: Step 1: Prepare your data You can import a CSV, TSV, KML, KMZ, GPX, or XLSX file, or a sheet from Google Drive. Note: You can import only one data file per layer, and each file can have up to 2,000 rows. Step 2: Import content Open My Maps on your computer. Places will be automatically added to the map and available in a list in the legend on the left. Troubleshooting imports You might receive an error when trying import a file from Drive. Next steps
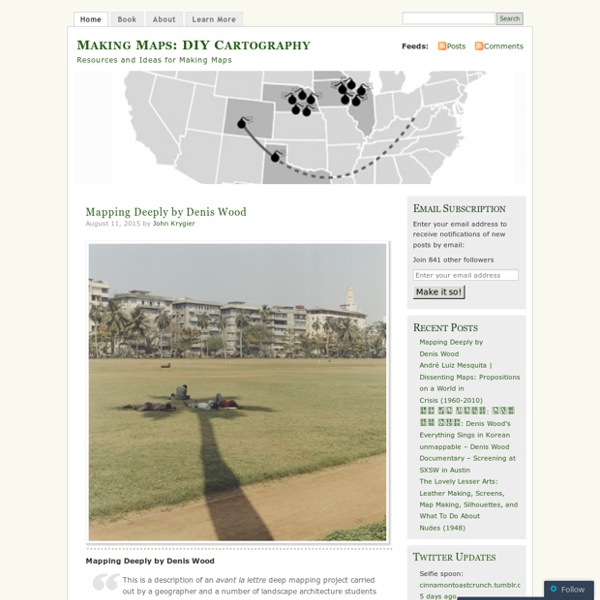
Essays | South America Conference | December 2008 Extremes of wealth and poverty in São Paulo, as is often cited by this image of the Paraisópolis favela sitting cheek-by-jowl to gated complexes of wealthy Morumbi, only partially capture the city’s deep inequality. One of the most iconic views of contemporary São Paulo, commonly used in international publications dealing with the city, is a picture in Morumbi showing the favela Paraisópolis on one side of a wall and a luxury building with tennis courts and one swimming pool per balcony on the other. However, the scholarly literature on the city and several of its main instruments of urban policy insist on another image: one that contrasts a rich and well-equipped centre with a poor and precarious periphery. According to this view, the city is made not only of opposed social and spatial worlds but also of clear distances between them. Undoubtedly, São Paulo has always been a city marked by sharp social inequalities. Conversations about crime have been common since the 1980s.
Antique Maps and Charts 30 Superb Examples of Infographic Maps As you search the web you’ll come across a wide range of interactive and graphical maps. Deciding when, where and how to integrate or display a map on your site is the first step, the second should be what technology and illustrations to use. If you’re all about interaction, JQuery, Ajax, or Flash are all effective technologies that hold their own ground. Map illustrations are a dime a dozen however, a strong and balanced display of graphics, information, and colors is what makes an infographic stand out and reach its target audience effectively. As designers, we’re constantly searching for ways to improve and style our designs, this is exactly what the following 30 infographics and sites display below; the breaking of rules. Sites with Interactive Maps Illustrative Infographics Compiled exclusively for WDD by Liz Fulghum. Did we miss any great examples?
British Museum uses Google Street View technology to put thousands of objects online and curate Museum of the World The world will be able to tour the British Museum online thanks to a new alliance between curators and Google© British Museum Neil MacGregor, the Director of the British Museum, says a new Street View tour allowing access to the museum’s permanent gallery and more than 4,500 objects represents a modern version of the age of Enlightenment during which the museum was founded in 1753. The Admonitions Scroll dates from the 6th century© British Museum One of the most important Chinese scrolls in the British Museum’s collection – the 6th century Admonitions Scroll, which is usually only visible for a few months each year due to their fragility – has been vividly rendered for a global audience as part of the partnership with the Google Cultural Institute. The timeline-based Museum of the World© British Museum © British Museum “The world today has changed,” says MacGregor. “And this isn’t just about putting the collection online. What do you think?