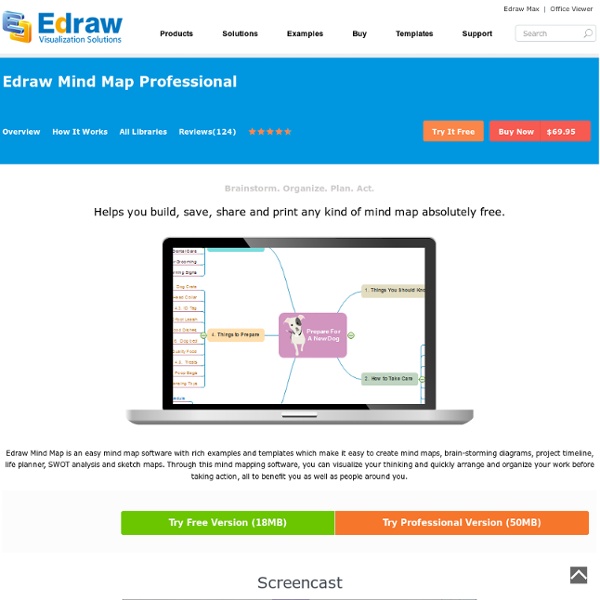
Edraw Mind Map Professional
Clarify Thinking Edraw can easily conceptualize your visualization on computer and organize your work. It helps you pull all ideas and assets together to organize them in logical structure, then to steer clear of irrelevant information and recognize the critical. Finally, you can better evaluate the profit, cost and risk for better decisions. Arouse Interests People often lose interest when facing piles of materials with only text which are boring and rigid. Boost Individual Brainstorming It is recommended to "look before you leap". Unlock Creativity In this highly competitive society, creativity is highly valued. Increase Productivity When the clock is ticking, high productivity is vital to ensure success.
15 Effective Tools for Visual Knowledge Management
Since I started my quest a few years ago searching for the ultimate knowledge management tool, I’ve discovered a number of interesting applications that help people efficiently organize information. There certainly is no shortage of solutions for this problem domain. Many tools exist that offer the ability to discover, save, organize, search, and retrieve information. However, I’ve noticed a trend in recent years, and some newer applications are focusing more on the visual representation and relationship of knowledge. I believe this is in part due to the wider adoption of mind mapping (and concept mapping), and leveraging concepts and advances in the semantic web community. 15. Link: Platforms: Win, Mac, Linux Cost: Free (Open Source) DeepaMehta is a “networked semantic desktop” that replaces the traditional computer desktop. 14. Link: Platforms: Mac Cost: $179 Tinderbox stores and organizes your notes, plans, and ideas. 13.
Vol 8 No 2. Mapping Knowledge: Concept Maps in Early Childhood Education
Share Mirar esta página en españolHomeJournal ContentsIssue ContentsVolume 8 Number 2©The Author(s) 2006 Mapping Knowledge: Concept Maps in Early Childhood Education Maria Birbili Aristotle University of Thessaloniki Graphic organizers such as webs, time lines, Venn diagrams, flowcharts, and concept maps are well known and widely used instructional and learning tools. They help teachers and students not only to identify and visually represent their views and knowledge but also to recognize and depict relationships among concepts. According to the “dual-coding” theory of information storage (Paivio, 1991), information is processed and stored in memory in two forms: a linguistic form (words or statements) and a nonlinguistic, visual form (mental pictures or physical sensations). Most visual teaching methods are well suited to the learning needs of preschool children. Concept maps were developed in the early 1970s at Cornell University by Novak and his research group (Novak, 1998).
Coggle | Top Picks
Loading ... Coggle is a browser-based organic-style mind-mapping application. It supports simultaneous, multi-user editing with chat. It allows free placement of nodes and can also make a new map from an existing FreeMind (.mm) file. Nodes can also have web links and images attached. Price: Free Special attribute: Supports LaTeX for mathematical notation. More screenshots and details for Coggle on Mind-mapping.org Top Picks are tools that are in the mainstream of mapping or are significant because they have special attributes that you won’t easily find in other tools. Google
Cmap | Cmap Software
Joseph D. Novak & Alberto J. Cañas Institute for Human and Machine Cognition Pensacola Fl, 32502 www.ihmc.us Technical Report IHMC CmapTools 2006-01 Rev 2008-01 Introduction Concept maps are graphical tools for organizing and representing knowledge. Figure 1. (click on the image to display a larger image) Another characteristic of concept maps is that the concepts are represented in a hierarchical fashion with the most inclusive, most general concepts at the top of the map and the more specific, less general concepts arranged hierarchically below. Another important characteristic of concept maps is the inclusion of cross-links. A final feature that may be added to concept maps is specific examples of events or objects that help to clarify the meaning of a given concept. Concept maps were developed in 1972 in the course of Novak’s research program at Cornell where he sought to follow and understand changes in children’s knowledge of science (Novak & Musonda, 1991). Figure 2. Figure 3.
Thinkmap visualization software facilitates communication, learning, and discovery.
Choose Your Product | mywebspiration.com
Related:
Related:


