

Why people hate statistics - but you don't need to - with Dr Nic. Statistics for people in a hurry. Free teaching resources: A world of mathematicians. Strategies and Best Practices for Data Literacy Education. Excel in Statistics and Operations Research. I love spreadsheets The spreadsheet package is a wondrous thing.
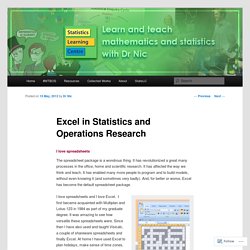
It has revolutionized a great many processes in the office, home and scientific research. It has affected the way we think and teach. It has enabled many more people to program and to build models, without even knowing it (and sometimes very badly). And, for better or worse, Excel has become the default spreadsheet package. I have used Excel to create crosswords I love spreadsheets and I love Excel. Videos about spreadsheets I have even made YouTube videos about Excel spreadsheets. Excel and Statistics There are different schools of thought about using Excel in the teaching of statistics and operations research. Spreadsheets, statistics, mathematics and computational thinking. We need to teach all our students how to design, create, test, debug and use spreadsheets.
We need to teach this integrated with mathematics, statistics and computational thinking. Spreadsheets can be a valuable tool in many other subject areas including biology, physics, history and geography, thus facilitating integrated learning experiences. Teaching statistical language. I received a phone call from the company that leases us our equipment.
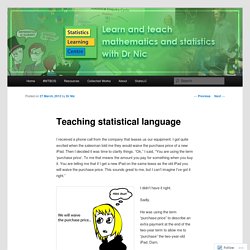
I got quite excited when the salesman told me they would waive the purchase price of a new iPad. Then I decided it was time to clarify things. “Ok,” I said, “You are using the term ‘purchase price’. To me that means the amount you pay for something when you buy it. It is so random! Or is it? The meaning of randomness. First there is the problem of lexical ambiguity.
There are colloquial meanings for random that don’t totally tie in with the technical or domain-specific meanings for random. Then there is the fact that people can’t actually be random. Then there is the problem of equal chance vs displaying a long-term distribution. And there is the problem that there are several conflicting ideas associated with the word “random”. Glossary / Mathematics and statistics. Statistics This glossary describes terms used in the achievement objectives of the statistics strand of the curriculum, as well as other related terms.

Many of these terms have other meanings when used in other contexts. This glossary provides meanings only in a statistics context. Book: stats done wrong. Over 100 Incredible Infographic Tools and Resources (Categorized) - DailyTekk. This post is #6 in DailyTekk’s famous Top 100 series which explores the best startups, gadgets, apps, websites and services in a given category.
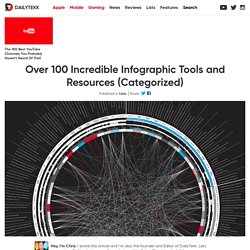
Total items listed: 112. Time to compile: 8+ hours. Follow @DailyTekk on Twitter to make sure you don’t miss a week! Timeline of Statistics. Teaching a service course in statistics. Excel, SPSS, Minitab or R? I often hear this question: Should I use Excel to teach my class?
Or should I use R? Which package is the best? Update in April 2018: I have written a further post, covering other aspects and other packages. The short answer is: It depends on your class. You have to ask yourself, what are the attitudes, skills and knowledge that you wish the students to gain in the course. If the students are never likely to do any more statistics, what matters most is that they understand the elementary ideas, feel happy about what they have done, and recognise the power of statistical analysis, so they can later employ a statistician. If the students are strong in programming, such as engineering or computer science students, then they are less likely to find the programming a barrier, and will want to explore the versatility of the package. Statistical software for worried students. Statistical software for worried students: Appearances matter Let’s be honest.
Most students of statistics are taking statistics because they have to. I asked my class of 100 business students who choose to take the quantitative methods course if they did not have to. Two hands went up. Face it – statistics is necessary but not often embraced. But actually it is worse than that. Choice of software. iNZight for Data Analysis. Don't teach students the hard way first.
Imagine you were going to a party in an unfamiliar area, and asked the host for directions to their house.
It takes you thirty minutes to get there, on a path that takes you on a long winding road with slow traffic. As the party ends, the host tells you “You can take the highway on your way back, it’ll take you only ten minutes. I just wanted to show you how much easier the highway is.” Wouldn’t you be annoyed? And yet this kind of attitude is strangely common in programming education. I was recently talking to a friend who works with R and whose opinions I greatly respect. Arthur Benjamin: Teach statistics before calculus! Someone always asks the math teacher, "Am I going to use calculus in real life?
" And for most of us, says Arthur Benjamin, the answer is no. He offers a bold proposal on how to make math education relevant in the digital age. TEDTalks is a daily video podcast of the best talks and performances from the TED Conference, where the world's leading thinkers and doers give the talk of their lives in 18 minutes. Featured speakers have included Al Gore on climate change, Philippe Starck on design, Jill Bolte Taylor on observing her own stroke, Nicholas Negroponte on One Laptop per Child, Jane Goodall on chimpanzees, Bill Gates on malaria and mosquitoes, Pattie Maes on the "Sixth Sense" wearable tech, and "Lost" producer JJ Abrams on the allure of mystery.