

GAM. Mixed Models. What Regression Really Is. Bookmark this one, will you, folks?

If there’s one thing we get more questions about and that is more abused than regression, I don’t know. So here is the world’s briefest—and most accurate—primer. There are hundreds of variants, twists and turns, and tweaks galore, but here is the version most use unthinkingly. Take some thing in which you want to quantify the uncertainty. Call it y: y can be somebody’s income, their rating on some HR form, a GPA, their blood pressure, anything. Why do beginner econometricians get worked up about the wrong things? People make elementary errors when they run a regression for the first time.

They inadvertently drop large numbers of observations by including a variable, such as spouse's hours of work, which is missing for over half their sample. They include every single observation in their data set, even when it makes no sense to do so. For example, individuals who are below the legal driving age might be included in a regression that is trying to predict who talks on the cell phone while driving. People create specification bias by failing to control for variables which are almost certainly going to matter in their analysis, like the presence of children or marital status. Which regression technique to apply? 15 Types of Regression you should know. Regression techniques are one of the most popular statistical techniques used for predictive modeling and data mining tasks.
On average, analytics professionals know only 2-3 types of regression which are commonly used in real world. They are linear and logistic regression. But the fact is there are more than 10 types of regression algorithms designed for various types of analysis. Each type has its own significance. What do practitioners need to know about regression? Fabio Rojas writes: In much of the social sciences outside economics, it’s very common for people to take a regression course or two in graduate school and then stop their statistical education.
This creates a situation where you have a large pool of people who have some knowledge, but not a lot of knowledge. As a result, you have a pretty big gap between people like yourself, who are heavily invested in the cutting edge of applied statistics, and other folks.So here is the question: What are the major lessons about good statistical practice that “rank and file” social scientists should know? Sure, most people can recite “Correlation is not causation” or “statistical significance is not substantive significance.”
But what are the other big lessons? Six quick tips to improve your regression modeling. It’s Appendix A of ARM: A.1.
Fit many models Think of a series of models, starting with the too-simple and continuing through to the hopelessly messy. Generally it’s a good idea to start simple. Or start complex if you’d like, but prepare to quickly drop things out and move to the simpler model to help understand what’s going on. Some useful predictors. Dummy variables So far, we have assumed that each predictor takes numerical values.
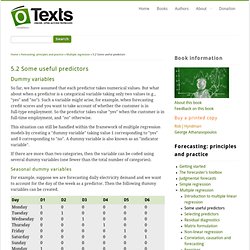
But what about when a predictor is a categorical variable taking only two values (e.g., "yes" and "no"). Such a variable might arise, for example, when forecasting credit scores and you want to take account of whether the customer is in full-type employment. Selecting predictors. When there are many possible predictors, we need some strategy to select the best predictors to use in a regression model.
A common approach that is not recommended is to plot the forecast variable against a particular predictor and if it shows no noticeable relationship, drop it. Strategy for building a “good” predictive model. By Ian Morton.
Ian worked in credit risk for big banks for a number of years. He learnt about how to (and how not to) build “good” statistical models in the form of scorecards using the SAS Language. Read original post and similar articles here . Using Norms to Understand Linear Regression. Introduction In my last post, I described how we can derive modes, medians and means as three natural solutions to the problem of summarizing a list of numbers, (x_1, x_2, \ldots, x_n), using a single number, s.
In particular, we measured the quality of different potential summaries in three different ways, which led us to modes, medians and means respectively. Each of these quantities emerged from measuring the typical discrepancy between an element of the list, x_i, and the summary, s, using a formula of the form, \sum_i |x_i – s|^p, When NOT to Center a Predictor Variable in Regression.
There are two reasons to center predictor variables in any time of regression analysis–linear, logistic, multilevel, etc. 1.
How is 95% CI calculated using confint in R. Interpreting the Intercept in a Regression Model. The intercept (often labeled the constant) is the expected mean value of Y when all X=0. Start with a regression equation with one predictor, X. If X sometimes = 0, the intercept is simply the expected mean value of Y at that value. If X never = 0, then the intercept has no intrinsic meaning. In scientific research, the purpose of a regression model is to understand the relationship between predictors and the response. If so, and if X never = 0, there is no interest in the intercept. You do need it to calculate predicted values, though. When is it ok to remove the intercept in lm()? Interpreting the drop1 output in R. Predictors, responses and residuals: What really needs to be normally distributed? Introduction Many scientists are concerned about normality or non-normality of variables in statistical analyses.
The following and similar sentiments are often expressed, published or taught: Stata-style regression summaries. Linear combinations of coefficients in R. Gentle Intro to tidymodels. By Edgar Ruiz Recently, I had the opportunity to showcase tidymodels in workshops and talks. Because of my vantage point as a user, I figured it would be valuable to share what I have learned so far.
Let’s begin by framing where tidymodels fits in our analysis projects. The diagram above is based on the R for Data Science book, by Wickham and Grolemund. The version in this article illustrates what step each package covers. It is important to clarify that the group of packages that make up tidymodels do not implement statistical models themselves. In a way, the Model step itself has sub-steps. Feature scaling/normalization and prediction. Butcher: Reduce the size of model objects saved to disk. The most useful content begins under the second section on the butcher package. Feel free to skip the backstory. “Learn to fail often and fail fast.” - Hadley Wickham This summer I was given the chance to build a new R package that reduces the size of modeling objects saved to disk. This internship project was aptly named object scrubber and was catalyzed by two main problems: The environment (which may carry a lot of junk) is often saved along with the fitted model object; andRedundancies in the structure of the model object itself often exist.
These problems are a recurring theme as referenced in the examples below: Some heuristics about local regression and kernel smoothing. In a standard linear model, we assume that . Alternatives can be considered, when the linear assumption is too strong. That’s Smooth. Some heuristics about spline smoothing. Let us continue our discussion on smoothing techniques in regression. Assume that . Regression diagnostic plots. 19 October 2011. Evaluating model performance - A practical example of the effects of overfitting and data size on prediction. Following my last post on decision making trees and machine learning, where I presented some tips gathered from the "Pragmatic Programming Techniques" blog, I have again been impressed by its clear presentation of strategies regarding the evaluation of model performance.
I have seen some of these topics presented elsewhere - especially graphics showing the link between model complexity and prediction error (i.e. Can We do Better than R-squared? Correlation - When can we speak of collinearity. Multicollinearity. Roughly speaking, Multicollinearity occurs when two or more regressors are highly correlated. What are 'aliased coefficients'? How to create confounders with regression: a lesson from causal inference. Another reason to be careful about what you control for. Modeling data without any underlying causal theory can sometimes lead you down the wrong path, particularly if you are interested in understanding the way things work rather than making predictions. It might just be regression to the mean. Likelihood Ratio Test. Comparing Cox models - AIC? How to Compare Nested Models in R. Using R and the anova function we can easily compare nested models. Where we are dealing with regression models, then we apply the F-Test and where we are dealing with logistic regression models, then we apply the Chi-Square Test.
By nested, we mean that the independent variables of the simple model will be a subset of the more complex model. Interactions R package: Comprehensive, User-Friendly Toolkit for Probing Interactions. Interpreting interaction coefficient in R (Part1 lm) Interaction are the funny interesting part of ecology, the most fun during data analysis is when you try to understand and to derive explanations from the estimated coefficients of your model. Regression - Should I keep the interaction term. To Compare Regression Coefficients, Include an Interaction Term. Test a significant difference between two slope values. Comparing 2 regression slopes by ANCOVA. Subsets vs pooling in regressions with interactions. A novel method for modelling interaction between categorical variables. Why is power to detect interactions less than that for main effects?
Change over time is not "treatment response" Robustness of simple rules. Data calls the model’s bluff. The Titanic Effect. Meta-analysis - JBI Manual. Meta-analysis in medical research. How to Conduct a Meta-Analysis of Proportions in R. Meta Analysis Fixed vs Random effects. Camarades meta-analysis tool.