

Phd. Data Science Cheat Sheets – Python / R / MySQL & SQL / Spark / Hadoop & Hive / Machine Learning / Django – AITS – Data Mining Club. Gear up to speed and have Data Science & Data Mining concepts and commands handy with these cheatsheets covering R, Python, Django, MySQL, SQL, Hadoop, Apache Spark and Machine learning algorithms.
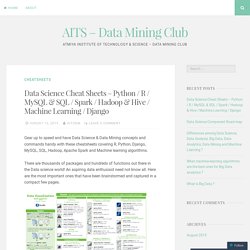
There are thousands of packages and hundreds of functions out there in the Data science world! An aspiring data enthusiast need not know all. Here are the most important ones that have been brainstormed and captured in a compact few pages. Mastering Data science involves understanding of statistics, Mathematics, Programming knowledge especially in R, Python & SQL and then deploying a combination of all these to derive insights using the business understanding & a human instinct—that drives decisions.
Here are the cheatsheets by category: Cheat sheets for Python: Python is a popular choice for beginners, yet still powerful enough to back some of the world’s most popular products and applications. Cheat sheets for R: The R’s ecosystem has been expanding so much that a lot of referencing is needed. 18 New Must Read Books for Data Scientists on R and Python. Introduction “It’s called reading.
It’s how people install new software into their brain” Personally, I haven’t learnt as much from videos & online tutorials as much I’ve learnt from books. Until this very moment, my tiny wooden shelf has enough books to keep me busy this winter. Learn Big Data Analytics using Top Youtube Tutorial Videos & TED Talks. Introduction.
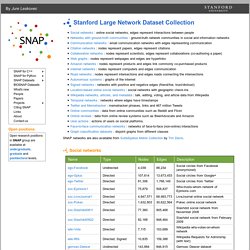
Large Network Dataset Collection. Social networks Networks with ground-truth communities Communication networks Citation networks Collaboration networks Web graphs Product co-purchasing networks Internet peer-to-peer networks.
Machine Learning Repository. Datasets for Data Mining and Data Science. See also Data repositories AssetMacro, historical data of Macroeconomic Indicators and Market Data.
Awesome Public Datasets on github, curated by caesar0301. Analytics Academy. 50 Resources for Getting the Most Out of Google Analytics. Google Analytics is a very useful free tool for tracking site statistics.
For most users, however, it never becomes more than just a pretty interface with interesting graphs. The resources below will help anyone, from the beginner to those who have been using Google Analytics for some time, learn how to get the most out of this great tool. Google Analytics Tips: 10 Data Analysis Strategies That Pay Off Big! Common Google Universal Analytics Mistakes that kill your Analysis & Conversions. I have audited hundreds of web analytics accounts and profiles.
And each account/view had at least one or two issues which seriously stood in my way of getting optimum results from my analysis. I have put all of these issues into five broad categories: Directional Issues Data Collection Issues Data Integration issues Data Interpretation Issues Data Reporting Issues These are the most common mistakes that kill your analysis, reporting and conversions. In order to get optimum results from your analysis of Universal Analytics reports you must aim to find and fix as many of these issues as possible. Failing to do so will almost always result in inaccurate analysis, interpretation and reporting. 1.
These issues are not associated with Google Universal Analytics or any other analytics software you use but are commonly found in analysts themselves and are reflected in the way they set up Google Analytics account, advanced segment, conversions segments, filters and custom reports. For example: 1. 2. Using the New Cohort Analysis in Google Analytics. The cohort was the basic tactical unit of Roman Legions following the reforms of Gaius Marius in 107 BC.
Initially a Roman legion consisted of ten cohorts, each consisting of 480 men. Today we use the term cohort to distinguish between groups of consumers to help us make them spend more money on things they probably don’t need. Progress? I guess I’d rather live in a world where we try and get people to spend more money on shoes, than die violently by taking a spear to my chest while fighting Carthaginians; but it’s close.
And now Google Analytics has a fancy new Cohort Analysis Report that lets us analyze the death rates from the Second Punic War… Er… no… it helps us analyze the consumer/shoe thing. Ok, So What are Cohorts? For our purposes – cohorts are a way of grouping together people (or content), usually, based on date, and for our purposes it’s grouping them by their first session on a website. Google Public Data Explorer. Advanced Content Analysis in Google Analytics. The author's posts are entirely his or her own (excluding the unlikely event of hypnosis) and may not always reflect the views of Moz.
We analyze the performance of our content every day. Sometimes it's subconscious, like when we check the number of tweets we get from a new blog post. Other times, we make more conscious efforts, like reviewing performance metrics in Google Analytics. This feedback—both formal and anecdotal—informs what we do next. It influences future blog posts and validates our strategies. Paying attention to which of your content efforts are working well is the cornerstone to data-driven marketing. These articles show how taking data-driven approach to producing content can produce great results.
I don't know about you, but exponential traffic sounds pretty great to me! But we will never get there without taking a methodical and data-driven approach to our efforts. It's time to take things to the next level! In the past, I would have to do this in a manual fashion. Google Analytics Official Website – Web Analytics & Reporting. Google BigQuery - Fully Managed Big Data Analytics Service.