

HR Key Performance Indicators: An In-depth Explanation with Metrics & Examples. “Without data, you’re just another person with an opinion”, is arguably Edward Deming’s best-known quote.
It is impossible to improve at managing people if you do not measure the results of your work. If you do not define what ‘good performance’ looks like and how you can measure it, how will you find out if you’re doing well? So in business, if you don’t measure your progress towards your HR goals, how will you know how successful you are? To measure success, you need performance indicators. Interpretable Machine Learning. Machine learning has great potential for improving products, processes and research.
But computers usually do not explain their predictions which is a barrier to the adoption of machine learning. This book is about making machine learning models and their decisions interpretable. After exploring the concepts of interpretability, you will learn about simple, interpretable models such as decision trees, decision rules and linear regression. #3 Using Multiple Linear Regression and R to model and predict ethnic diversity variation across teams – SAMBITDAS.ORG. This write up is divided into the following sections : Important assumptions and objectives of this case studyOverview of the sample datasetCreate a Multiple linear regression model to predict ethnicity variation on training data set.
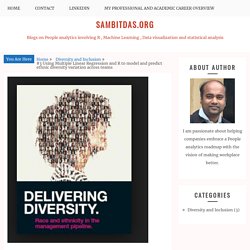
Determine key factors that influence diversity variationAscertain how well the model fits in sample through residual plot analysisApply model on out of sample test data and determine predictive accuracyGithub – Link to R code and sample data set usedReference Materialsggpair correlation plot between the significant predictors of ethnic diversity across the teams Section 1 : Important assumptions and objectives of this case study. How to make a self-service BI tools deployment less painful. The Five Models of People Analytics. Measuring Employee Engagement the Right Way. Why People Analytics isn’t Delivering on its Promised Value. Analyse de données : top 5 des algorithmes Big Data Analytics. Datavisualization.ch. Le workforce planning, enfin chef d’orchestre des RH - PremiumPeers.
Qu'est-ce qu'un indicateur de performance ? Définition KPI. Un indicateur de performance n'est pas un gadget, on s'en doute.
Cet élément clé de la mesure de la performance n'a d'autre rôle que celui d'orienter les actions dans le sens de l'accomplissement de la stratégie. Revenons sur le principe de base, les types d'indicateur avec exemples, la méthode de choix et les recommandations d'usage. Les indicateurs de performance sont comme les objets de pacotille vendus dans les bazars discount. On en trouve de toutes les formes, de toutes les couleurs, du plus ordinaire au plus insolite, mais il faudra chercher longtemps pour en trouver un bien conçu et réellement utile. UL EHS Sustainability launches New Free tool simplifying OSHA. UL EHS Sustainability, known as an industry leader in safety and health software solutions and training, has today announced the launch of a free software tool that could help streamline OSHA reporting requirements.

The free online tool is created on the PureOHS platform - UL's proprietary framework built to streamline data management systems. The new tool helps users enter relevant data and retrieve outputs for all the required forms as need by OSHA. Mark Ward, GM, UL EHS Sustainability, shared his thoughts on the importance of faster, smarter and more effective data tracking - and the need to keep all injury data in an automated firmament: Le coefficient Bradford. Press: Le groupe Bolloré choisit Information Builders pour automatiser... Sèvres, le 26 Septembre 2007.
People Analytics Data Integrations - the Good, the Bad, and the Ugly. Our Experience Integrating HR Tech for People Analytics - a Vendor by Vendor Comparison.
This will be a living post and we will continue to update as we have time to collect thoughts on each vendor and certainly as we complete integrations to new vendors. Not every source we work with will be listed here but we'll cover the majors that often work with. At One Model we get to see the data and structure from a load of HR systems, and beyond, bascially anything that holds employee or person data is fair game as a core system to integrate for workforce analytics. La liste des listes des indicateurs RH – Mesurer le capital humain. Pourquoi et comment créer un Google CSE en recrutement. Here’s How to Evaluate Manager Effectiveness. As global markets push businesses to become more agile and responsive, it’s tempting to predict that management roles will virtually disappear from progressive companies.
But even Holacracy (a self-management structure made famous by online shoe retailer Zappos) has some hierarchy: Instead of “managers,” there are “lead links” who carry leadership functions and oversee new teams as they form and disband with each project cycle. While widespread adoption of Holacracy is not likely in the near future, many organizations are shifting towards more flat structures where teams are gaining in importance. Among 10,000 business and HR leaders, 94% report that agility and collaboration are key to their organization’s success, and 32% say that they are designing their organization to be more adaptable and team-centric, according to Deloitte’s 2017 Global Human Capital Trends report.
Rotation de l'emploi. Calcul des indicateurs RH. What Do Termination Codes Have to Do With Making HR Data Strategic? What Does Dark Data Mean For HR? – The HR Tech Weekly® Dark data is predicted to be one of the emerging tech trends for 2017.
As businesses explore more ways to transform talent management processes and slowly move towards analytics, the swathes of information contained in dark data may prove to be the missing piece in the recruitment jigsaw. Gartner defines dark data as the ‘information assets organisations collect, process and store during regular business activities, but generally fail to use for other purposes’. It is used, inactive information found in unexplored files including e-mails, messages, spreadsheets, pdfs, audio and video files. 33 Human Capital KPIs & Scorecard Measures. ClearPoint: Balanced Scorecard Software For Teams That Get Things Done In the past decade, human resources (HR) and human capital has evolved from a being a solely service-oriented benefits management department to a more strategic organizational asset.
Managers seem to recognize that it is now (more than ever) vital to have the right team executing company strategy. Well-known organizations and enterprises from all over the world regularly discuss how important it is to hire and retain the right talent, and this ability is often regarded as one of the greatest predictors of organizational success. While many organizations recognize this shift in thought, not all of them are correctly measuring success with updated HR key performance indicators (KPIs).
These strategic tools can help you understand whether you’re accomplishing your HR objectives in a way that is in line with your strategy. 21 Employee Performance Metrics - Analytics in HR. How HR Analytics Can Help You Predict Work Accidents - Case StudyHR Analytics Insights. Even in the most advanced safety-oriented organizations, current safety practices generally involve the analysis of historic (descriptive) work accident data to identify potential issues or risks.
This largely relies on retrospective analysis that provides a mirror view and is limited to data directly related to the accident itself (who, what, why, when, etc.). Unfortunately, these merely descriptive and single-source analyses provide us with little insight. The ‘R’ in Human [R]esources (or: a very brief introduction to the statistical package ‘R’ for HR) I studied psychology in Marburg (Germany). At university we exclusively used SPSS. The courses were among my classmates usually not the most popular. Paradoxe de Simpson. Illustration du paradoxe de Simpson pour un échantillon de données : alors que des tendances positives apparaissent dans les échantillons rouge et bleu, l'union des deux échantillons présente une tendance négative (représentée par la droite pointillée noire). Le paradoxe de Simpson ou effet de Yule-Simpson est un paradoxe statistique décrit par Edward Simpson en 1951 et George Udny Yule en 1903, dans lequel un phénomène observé de plusieurs groupes semble s'inverser lorsque les groupes sont combinés.
Ce résultat qui semble impossible au premier abord est lié à des éléments qui ne sont pas pris en compte (comme la présence de variables non indépendantes ou de différences d'effectifs entre les groupes, etc.) est souvent rencontré dans la réalité, en particulier dans les sciences sociales et les statistiques médicales. What to Do When Someone Angrily Challenges Your Data. Executive Summary A large, multinational company was conducting research on improving employee engagement when preliminary results uncovered a surprising and alarming pattern of gender bias. Initially, the head of HR attacked the messenger, but additional, more-rigorous research confirmed the disturbing findings — and convinced him to take action.
If you’re attacked for bringing hard truths to light, start by trying to take the perspective of the person you’ve angered; however poorly delivered, is any of their criticism valid?