
The Basics of Support and Resistance Explained. Contents Introduction The concepts of support and resistance are some of the most fundamental topics related to the technical analysis of financial markets.

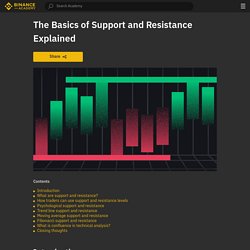
They apply to essentially any market, whether that’s stocks, forex, gold, or cryptocurrencies. While they’re simple concepts to understand, they’re actually quite difficult to master. Identifying them can be entirely subjective, they’ll work differently in changing market conditions, and you’ll need to understand their different types. What are support and resistance? On the most fundamental level, support and resistance are simple concepts. While more traditionally, support and resistance are indicated as lines, the real-world cases are usually not as precise. Let’s look at an example of a support level. Price bouncing in an area of support before a breakout. Now let’s look at a resistance level. Price unable to break an area of resistance.
An Introduction to The Dow Theory. Contents What is the Dow Theory?

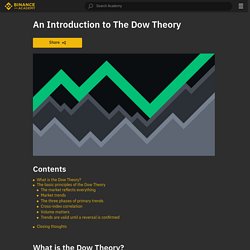
Essentially, the Dow Theory is a framework for technical analysis, which is based on the writings of Charles Dow concerning market theory. Dow was the founder and editor of the Wall Street Journal and the co-founder of Dow Jones & Company. As part of the company, he helped create the first stock index, known as the Dow Jones Transportation Index (DJT), followed by the Dow Jones Industrial Average (DJIA). Dow never wrote his ideas as a specific theory and didn’t refer to them as such. This article provides an introduction to the Dow Theory, discussing the different stages of market trends based on Dow’s work.
The basic principles of the Dow Theory The market reflects everything This principle is closely aligned with the so-called Efficient Market Hypothesis (EMH). For example, if a company is widely expected to report positive improved earnings, the market will reflect this before it happens. Market trends The three phases of primary trends Volume matters. What is Technical Analysis? Technical analysis (TA), often referred to as charting, is a type of analysis that aims to predict future market behavior based on previous price action and volume data.

The TA approach is extensively applied to stocks and other assets in traditional financial markets, but it is also an integral component of trading digital currencies in the cryptocurrency market. In contrast to fundamental analysis (FA), which considers multiple factors around the price of an asset, TA is strictly focused on historical price action. Therefore, it is utilized as a tool to examine an asset's price fluctuations and volume data, and many traders employ it on an attempt to identify trends and favorable trading opportunities. While primitive forms of technical analysis appeared in the 17th century Amsterdam and 18th century Japan, the modern TA is often traced back to the work of Charles Dow.
Does Technical Analysis Work? I have been delaying writing this article for some time now, simply because of the number of sub-arguments that arise when one tries to answer whether technical analysis works.

I am going to try to keep my arguments as simple and pertinent as possible. This article is primarily aimed at: — Those who have heard the term technical analysis but do not know what it entails — Those who are well aware of the practice but remain sceptical It is at this point I should stress that by no means am I rehashing some orthodox doctrine on what technical analysis is and isn’t (if there were such a thing).
Moreover, just to make my position clear: I am primarily a technical trader, therefore my implicit position is that technical analysis ‘works’ (to be defined later). Top 5 Technical Analysis Mistakes Beginners Make. Nota bene: I) This is not financial advice and I am not a financial advisor.

I’m sure there’re plenty of licenced professionals in your jurisdiction. Speak to them, not strangers on the internet with Hyman Minsky avatars. II) This article is primarily aimed at cryptocurrency traders. Technical analysis is hard. For beginners, it is especially daunting seeing technical analysis (henceforth “TA”) done in so many different ways on Twitter and other platforms where analysts share their work. There’s no single ‘right’ way to do TA. Discussing where someone wanting to learn TA from scratch should start is beyond the scope of this article, and most likely warrants an article of its own. This article is aimed at those who’ve started learning TA and consistently practice their charting. The list is not exhaustive and I’m sure I’ve missed out on many important things. But it’s a start. These are 5 things — in no particular order — that I wish someone had told me to avoid when I started out. 2.
Not fun. 3.
Technical Indicators and Oscillators. Fibonacci. Trading. Books. Trading View. Crypto Margin Trading. ChartAlerts. Automate Your Crypto Currency Technical Analysis.