
Common statistical tests are linear models (or: how to teach stats) By Jonas Kristoffer Lindeløv (blog, profile). Last updated: 28 June, 2019 (See changelog). Check out the Python version and the Twitter summary. This document is summarised in the table below. It shows the linear models underlying common parametric and “non-parametric” tests. Formulating all the tests in the same language highlights the many similarities between them. Most of the common statistical models (t-test, correlation, ANOVA; chi-square, etc.) are special cases of linear models or a very close approximation. This needless complexity multiplies when students try to rote learn the parametric assumptions underlying each test separately rather than deducing them from the linear model. For this reason, I think that teaching linear models first and foremost and then name-dropping the special cases along the way makes for an excellent teaching strategy, emphasizing understanding over rote learning.
Use the menu to jump to your favourite section. Show Source Theory: As linear models. An Introductory Guide to Maximum Likelihood Estimation (with a case study in R)
Sample Size Calculators. New R package for K-S goodness-of-fit tests. This is a re-post from the R packages mailing list Greetings, We wanted to announce a new R package ‘KScorrect’ that carries out the Lilliefors correction to the Kolmogorov-Smirnoff test for use in (one-sample) goodness-of-fit tests.

It’s well-established it’s inappropriate to use the K-S test when sample statistics are used to estimate parameters, which results in substantially increased Type-II errors. This warning is mentioned in the ks.test Help page, but no general solution is currently available for non-normal distributions.
Using Google Analytics with R - ThinkToStart. For the most part, SMB’s tend to utilize free analytics solutions like Google Analytics for their web and digital strategy.

A powerful platform in its own right, it can be combined with the R to create custom visualizations, deep dives into data, and statistical inferences. This article will focus on the usage of R and the Google Analytics API. We will go over connecting to the API, querying data and making a quick time series graph of a metric. To make an API call, you’ll need two things.
A Client ID and a Secret ID.
Multilevel models. Formulae in R: ANOVA and other models, mixed and fixed. R’s formula interface is sweet but sometimes confusing.

ANOVA is seldom sweet and almost always confusing. And random (a.k.a. mixed) versus fixed effects decisions seem to hurt peoples’ heads too. So, let’s dive into the intersection of these three. I’m aware that there are lots of packages for running ANOVA models that make things nicer for particular fields. I’m just going to ignore them all here and focus on the builtin function aov and the standard mixed model package lme4. In the following, assume that Y is a dependent variable and A, B, C, etc. are predictors, all contained in data frame d. Formula Recap If you use R then you probably already know this, but let’s recap anyway.
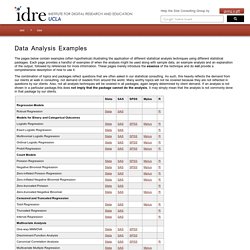
Sensitivity Analysis. Fitdistrplus: An R Package for Fitting Distributions. Nparcomp: An R Software Package for Nonparametric Multiple Comparisons. Dynamical Systems - Kalman Filter. Big Data. Quality control. Bayesian. Risk Analysis / Decision making. MOOCs. Data Analysis Examples. The pages below contain examples (often hypothetical) illustrating the application of different statistical analysis techniques using different statistical packages.

Each page provides a handful of examples of when the analysis might be used along with sample data, an example analysis and an explanation of the output, followed by references for more information. These pages merely introduce the essence of the technique and do not provide a comprehensive description of how to use it. The combination of topics and packages reflect questions that are often asked in our statistical consulting. As such, this heavily reflects the demand from our clients at walk in consulting, not demand of readers from around the world. Many worthy topics will not be covered because they are not reflected in questions by our clients. For grants and proposals, it is also useful to have power analyses corresponding to common data analyses.
Resources to help you learn and use R.
Machine Learning. Clustering. Classification. Neural Networks. GLM - GAM. Finding the Best Subset of a GAM using Tabu Search and Visualizing It in R. The famous probabilist and statistician Persi Diaconis wrote an article not too long ago about the "Markov chain Monte Carlo (MCMC) Revolution.

" The paper describes how we are able to solve a diverse set of problems with MCMC. The first example he gives is a text decryption problem solved with a simple Metropolis Hastings sampler. I was always stumped by those cryptograms in the newspaper and thought it would be pretty cool if I could crack them with statistics. So I decided to try it out on my own. The example Diaconis gives is fleshed out in more details by its original authors in its own article.
Optimization. Anova. Repeated Measures. Cross-over Trials. Bootstrap. Regression. PCA / FA / CA.