

Exploring the History of Ecological Design – Age of Awareness. Human ingenuity may make various inventions … but it will never devise any invention more beautiful, nor more simple, nor more to the purpose than Nature does; because in her inventions nothing is wanting and nothing is superfluous. — Leonardo da Vinci 1452–1519 (in Schneider, 1995, p.189) Much can be written on the history of ecologically conscious design.
Human pre-history and history is full of examples of appropriate and of disastrous environmental management and resource use. The oldest written record of humanity is the Epic of Gilgamesh, a remnant of the Sumerian civilization, which inhabited the fertile crescent of Mesopotamia around 4000 BC. The epic tells the story of a king defying the warning of the forest-god Humbaba and cutting down the sacred cedar forests of Lebanon in a vain project to build ever-bigger palaces in the ancient royal city of Ur. But we don’t have to look to ancient history to find examples.
This list only includes those people, who have passed on. Slate’s Use of Your Data. HOME - Ecological Footprint - Ecological Sustainability. Untitled. De fyra livsstilsvalen som är mest effektiva för att minska din klimatpåverkan. I studien analyserades 39 olika källor för att beräkna vilka livsstilsval som är mest effektiva för att minska koldioxidutsläpp i utvecklade delar av världen.
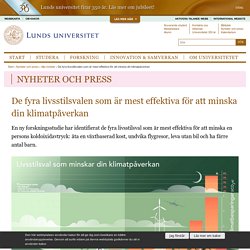
Källorna omfattar vetenskapliga artiklar, statliga dokument och olika typer av kolkalkylatorer. – Nu har vi en bättre uppfattning om vilka personliga val som gör mest skillnad för klimatet. Det gör att vi kan fokusera på de handlingar som har störst effekt, säger Kimberly Nicholas, en av författarna till studien, vid Lund University Centre for Sustainability Studies. COTAP's Carbon Footprint Calculator: Quick, Thorough, & Accurate. Offsetting your carbon footprint with COTAP creates income for the world’s poorest people while also counteracting your unavoidable contribution to climate change.

Where Your Money Goes Your tonnes will be evenly allocated to our projects and you will receive a detailed offset acknowledgement like this one. Your tonnes will be included in our public carbon credit retirements on the Markit Environmental Registry like this. You can track COTAP’s progress and download projects’ annual reports, which contain detailed accounting of payments to communities, in our Transparency section. Learn More About COTAP To learn more, please see the Mission, Projects, How It Works, How We’re Different, Transparency, and Standards sections of our site and see our above menu. Ecological footprint of European countries — European Environment Agency. Key messages The total ecological footprint for the EU-28 countries increased rapidly during the 1960s and 70s, and has remained relatively constant since the 1980s.
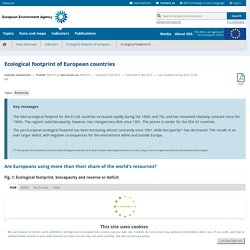
The region’s total biocapacity, however, has changed very little since 1961. The picture is similar for the EEA-33 countries. The pan-European ecological footprint has been increasing almost constantly since 1961, while biocapacity(1) has decreased. This results in an ever larger deficit, with negative consequences for the environment within and outside Europe. (1) The capacity of ecosystems to produce useful biological materials and to absorb waste materials generated by humans, using current management schemes and extraction technologies. Fig. 3: Biocapacity time series by land type Europe’s ecological deficit[1] is considerable; its total demand for ecological goods and services exceeds what its own ecosystems supply. Ecological Footprint. Ecological Footprint What Is the Ecological Footprint?
The Ecological Footprint is rooted in the fact that all renewable resources come from the earth. It accounts for the flows of energy and matter to and from any defined economy and converts these into the corresponding land/water area required for nature to support these flows. The Ecological Footprint is defined as "the area of productive land and water ecosystems required to produce the resources that the population consumes and assimilate the wastes that the population produces, wherever on Earth the land and water is located.
"1 It compares actual throughput of renewable resources relative to what is annually renewed. Non-renewable resources are not assessed, as by definition their use is not sustainable. Footprint Basics. Human activities consume resources and produce waste, and as our populations grow and global consumption increases, it is essential that we measure nature’s capacity to meet these demands.
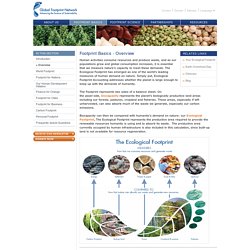
The Ecological Footprint has emerged as one of the world’s leading measures of human demand on nature. Simply put, Ecological Footprint Accounting addresses whether the planet is large enough to keep up with the demands of humanity. The Footprint represents two sides of a balance sheet. On the asset side, biocapacity represents the planet’s biologically productive land areas including our forests, pastures, cropland and fisheries. These areas, especially if left unharvested, can also absorb much of the waste we generate, especially our carbon emissions. My footprint. my knowledge. my friends. Ekologiska fotavtryck - Så beräknar man ekologiska fotavtryck. Vår konsumtion kräver utrymme WWFs fotavtrycksberäkningar uppskattar hur stor biologiskt produktiv yta som krävs för att ta fram allt vi konsumerar och absorbera avfallet som bildas.
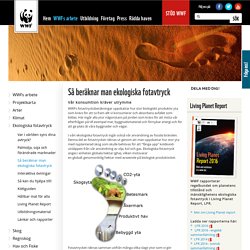
Här ingår alla ytor någonstans på jorden som krävs för att möta vår efterfrågan på till exempel mat, byggnadsmaterial och förnybar energi och för att ge plats åt våra byggnader och vägar. I vårt ekologiska fotavtryck ingår också vår användning av fossila bränslen. Denna del av fotavtrycket räknas ut genom att man uppskattar hur stor yta med nyplanterad skog som skulle behövas för att "fånga upp" koldioxid-utsläppen från vår användning av olja, kol och gas. Ekologiska fotavtryck anges i enheten globala hektar (gha), vilken motsvarar en globalt genomsnittlig hektar med avseende på biologisk produktivitet.