

Climate Change Just Changed. What's Really Warming the World? Climate deniers blame natural factors; NASA data proves otherwise. Climate scientists tend not to report climate results in whole temperatures. Instead, they talk about how the annual temperature departs from an average, or baseline. “Mini Era do Gelo”: a última cartada da indústria do petróleo. Changing Planet: Ocean Acidification. The dramatic increase in atmospheric CO2 in the past few decades has resulted in a startling increase in ocean acidity, which could have a large impact on marine life.

Some marine creatures build their skeletons and shells from calcium carbonate in seawater. As seawater gets more acidic these creatures will have a harder time building their skeletons and shells because calcium carbonate dissolves in acid. Click on the video at the left to watch the NBC Learn video - Changing Planet: Ocean Acidification. Lesson plan: Changing Planet: Ocean Acidification Shop Windows to the Universe Science Store! Traveling Nitrogen is a fun group game appropriate for the classroom. Minas Gerais já teve praia - Galileu. Já dizia o ditado: o sertão vai virar mar.

Não sabemos dizer se o evento profético realmente ocorrerá no futuro, mas um grupo de geólogos e paleontólogos da USP e da Unesp confirmaram que, no passado, uma enorme porção do interior do Brasil já foi coberta por um mar raso. “Essa deve ter sido a última praia que Minas Gerais teve”, brinca o geólogo Lucas Warren, da Unesp, em entrevista à FAPESP.
A equipe liderada por Warren descobriu na região de Januária (MG) fósseis da espécie cloudina incrustados em um paredão de rochas sedimentares. O extinto animal, que media até três centímetros, foi um dos primeiros a apresentar exoesqueleto, e viveu na Terra entre 550 e 542 milhões de anos atrás. Humans Cross Another Danger Line for the Planet. The views expressed are those of the author and are not necessarily those of Scientific American.
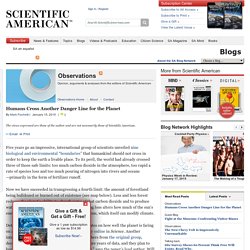
Five years go an impressive, international group of scientists unveiled nine biological and environmental “boundaries” that humankind should not cross in order to keep the earth a livable place. To its peril, the world had already crossed three of those safe limits: too much carbon dioxide in the atmosphere, too rapid a rate of species loss and too much pouring of nitrogen into rivers and oceans—primarily in the form of fertilizer runoff. Now we have succeeded in transgressing a fourth limit: the amount of forestland being bulldozed or burned out of existence (see map below). Less and less forest reduces the planet’s ability to absorb some of that carbon dioxide and to produce water vapor, crucial to plant life.
And the ongoing loss alters how much of the sun’s energy is absorbed or reflected across wide regions, which itself can modify climate. 2014: Global Temperature Stalls Another Year. According to the Nasa global temperature database 2014 was technically a record “beating” 2010 by the small margin of 0.02 deg C.
The NASA press release is highly misleading saying that 2014 is a record without giving the actual 2014 figure, or any other year, or its associated error. In reality of course it is no record at all as the error of the measurements is about +/- 0.1 deg C showing NasaGiss’ statement to go against the normal treatment of observational data and its errors. Talk of a record is therefore scientifically and statistically meaningless. Interestingly the December 2013-November 2014 NasaGiss figure was not the highest meaning that the “record” for 2014 merely depended on if December 2014 was warmer than December 2013.
The warm year that was 2014 has been attributed to exceptionally conditions in the north-east Pacific, that is not directly due to “global warming.” These are the countries most at risk from a climate change 'apocalypse' These maps claim to show which countries would be most vulnerable in the event of the effects of climate change reaching life-threatening levels - if they already haven’t.
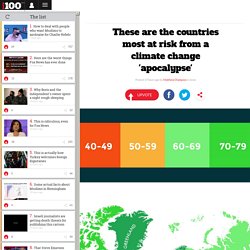
They were compiled using the ND-Gain Index, a project of the University of Notre Dame, in Indiana in the US. The index is built on two variables, vulnerability and readiness, and has been monitoring countries since 1995. Geo-Engineering Scientist ‘Terrified’ of Projects He Helped Create. Dr.

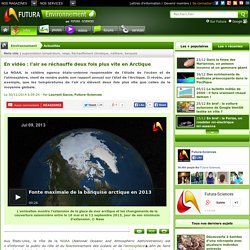
Matthew Watson from Bristol University in the UK told the media recently that he’s “terrified” by many of the geoengineering projects currently in the works to thwart man-made climate change, a phenomenon being hawked as an excuse for weather modification programs by many in mainstream science as a ‘threat to humanity.’ Dr. Watson recently told Daily Mail UK online that he is: “. . . terrified, because the potential for misstep is considerable.” En vidéo : l'air se réchauffe deux fois plus vite en Arctique. L'animation montre l’extension de la glace de mer arctique et les changements de la couverture saisonnière entre le 16 mai et le 12 septembre 2013, jour de son minimum d'extension. © Nasa Aux États-Unis, le rôle de la NOAA (National Oceanic and Atmospheric Administration) est « d’informer le public du rôle et du fonctionnement des océans et de l’atmosphère afin de faire des choix éclairés dans leurs interactions avec ceux-ci ».
Pour cela, elle publie par exemple chaque année depuis 2006, un rapport sur l’état de l’Arctique. Ce qui ne saurait surprendre puisque l’Alaska appartient à cette région. L’Arctic Report Card 2014 vient de sortir. Il fait le point autant sur l’évolution de la banquise que sur celle des populations d’ours polaires. Water's edge: the crisis of rising sea levels. Seis naciones al borde de la desaparición por el cambio climático.
The End and Beginning of the Arctic. Livro EA e Mudancas Climaticas_WEB.pdf. Conceitos básicos de Climatologia - Autores Importantes. Mudanças climáticas: dez pontos para se entender as discussões sobre o assunto. 01- Afinal , o que são as mudanças climáticas?

BIG NEWS VIII: New solar theory predicts imminent global cooling. To recap — using an optimal Fourier Transform, David Evans discovered a form of notch filter operating between changes in sunlight and temperatures on Earth.

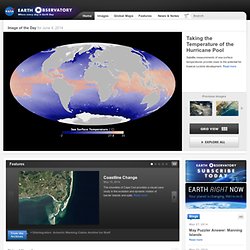
This means there must be a delay — probably around 11 years. Earth Observatory : Home. World of Change Satellite images showing how our world— forests, oceans, cities, even the Sun— has changed in recent decades.
Read more Blue Marble Composite satellite images of the entire Earth. Solving the puzzle of ice age climates. The paleoclimate record for the last ice age — a time 21,000 years ago called the “Last Glacial Maximum” (LGM) — tells of a cold Earth whose northern continents were covered by vast ice sheets. Chemical traces from plankton fossils in deep-sea sediments reveal rearranged ocean water masses, as well as extended sea ice coverage off Antarctica.
Air bubbles in ice cores show that carbon dioxide in the atmosphere was far below levels seen before the Industrial Revolution. Piers Corbyn on the Myth of Man-Made Global Warming. Climate Disasters.