

The Open University : KMi : Compendium : Software. ARG-tech. Argunet Editor - Argunet. Argunet Editor is a free argument map editor for analyzing and visualizing complex debates.
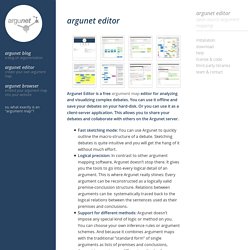
You can use it offline and save your debates on your hard-disk. Or you can use it as a client-server application. This allows you to share your debates and collaborate with others on the Argunet server. Fast sketching mode: You can use Argunet to quickly outline the macro-structure of a debate. Sketching debates is quite intuitive and you will get the hang of it without much effort.Logical precision: In contrast to other argument mapping software, Argunet doesn’t stop there.
If this all sounds like gibberish to you, don’t worry. Installation In order to run Argunet, a Java Runtime Environment 6.0 or higher has to be installed on your Computer. Please select the download files for your operations system below and follow the install instructions. To install the Argunet layout and export plugins open the ‘Help’ Menu in Argunet and select ‘Install Argunet plugins’. Download Microsoft Windows Mac OS X. DebateGraph. iLogos. Knowledge Management. Data, Information, Knowledge and Wisdom. From SystemsWiki by Gene Bellinger, Durval Castro, Anthony Mills There is probably no segment of activity in the world attracting as much attention at present as that of knowledge management.
Yet as I entered this arena of activity I quickly found there didn't seem to be a wealth of sources that seemed to make sense in terms of defining what knowledge actually was, and how was it differentiated from data, information, and wisdom. What follows is the current level of understanding I have been able to piece together regarding data, information, knowledge, and wisdom. I figured to understand one of them I had to understand all of them. According to Russell Ackoff [1989], a systems theorist and professor of organizational change, the content of the human mind can be classified into five categories: Ackoff indicates that the first four categories relate to the past; they deal with what has been or what is known. Mapping/GIS. Narzędzia do wizualizacji. WikiMindMap.
Best MindMapping Tools. DebateGraph. 20 rules of formulating knowledge in learning. Flashcards. 20+ Tools to Create Your Own Infographics. A picture is worth a thousand words – based on this, infographics would carry hundreds of thousands of words, yet if you let a reader choose between a full-length 1000-word article and an infographic that needs a few scroll-downs, they’d probably prefer absorbing information straight from the infographic.
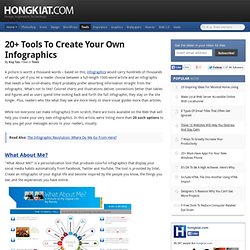
What’s not to like? Colored charts and illustrations deliver connections better than tables and figures and as users spend time looking back and forth the full infographic, they stay on the site longer. Plus, readers who like what they see are more likely to share visual guides more than articles. While not everyone can make infographics from scratch, there are tools available on the Web that will help you create your very own infographics. In this article, we’re listing more than 20 such options to help you get your messages across to your readers, visually. Advanced-mind-map-infographic.png (PNG Image, 1770 × 1377 pixels) - Scaled (47%) Creative Tools. MOOC Articles. Concept maps or mind maps? the choice. What are the differences between mind maps and concept maps?
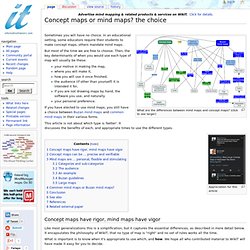
(click to see larger) Sometimes you will have no choice. In an educational setting, some educators require their students to make concept maps, others mandate mind maps. But most of the time we are free to choose. Then, the key determinants of when you would use each type of map will usually be these: your motive in making the map, where you will make it, how you will use it once finished, the audience (if other than yourself) it is intended it for, if you are not drawing maps by hand, the software you use, and naturally your personal preference. MindMapping: Visual e-Booklet MindMapPedia - Mind Map Encyclopedia. 5 Keys to Time Management. MindMapPedia - Mind Map Encyclopedia.
The 18 Best Free Web Tools Chosen By You. It’s the start of a new year and that means there’s infinite possibilities that lay before you.
But you can’t move forward without arming yourself with the best free web tools and apps. I was perusing some of my favorite education blogs, social networks, and other time-sucking online spots when I came back to the Edublog Awards. I’m proud that Edudemic was nominated for a bunch of awards (didn’t win but what can ya do) but more importantly I’m impressed with the amount of effort put forward by the Edublogs team. They’ve rounded up some of the best education and technology resources on the planet. Infographics.
Mindmapping. The Largest Online Collection of Visual Content. The "map sandwich" By Charlie Frye, Esri Chief Cartographer Last week we started telling you about the new ArcGIS Online World Topographic Map.
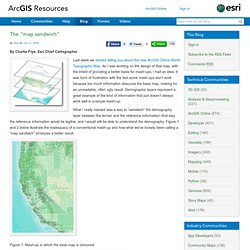
As I was working on the design of that map, with the intent of providing a better basis for mash-ups, I had an idea. It was born of frustration with the fact some mash-ups don’t work because too much information obscures the base map, making for an unreadable, often ugly result. Demographic layers represent a great example of the kind of information that just doesn’t always work well in a simple mash-up.
What I really needed was a way to “sandwich” the demography layer between the terrain and the reference information–that way the reference information would be legible, and I would still be able to understand the demography. Figure 1. Figure 2. The idea is to make a map that looks more like a map than a mash up. How the Map Sandwich Works. Data, Information, Knowledge and Wisdom. 20 rules of formulating knowledge in learning.