
The Futures Channel Educational Videos and Activities. Jaime Escalante Math Program Intro by Jaime Escalante In recent years I have been deluged with questions from interested teachers, community leaders, and parents about my success in teaching mathematics to poor minority children.

I am not a theoretician, my expertise is in the classroom and my first commitment is to my students. Nonetheless, I am willing to share my opinions on this subject in the hope that they might be helpful to other professionals in the field of education. I am hopeful this article will provide answers. Together, we will address two basic questions. 1. 2.
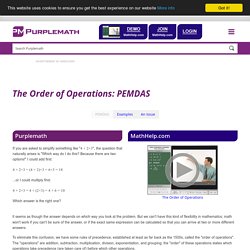
I. In 1952, while still an undergraduate in La Paz, Bolivia, I began teaching mathematics and physics – first at one high school, then a second, and finally a third. In the eighties and nineties, in the barrio of East Los Angeles, my students chant, “De-fense, De-fense, De-fense” (in this context: hard work, holding up under pressure, not giving your “opponent” an inch), or “Beat ETS!” Recruiting Students Scheduling. Math.com - Starting Skills. The Order of Operations: PEMDAS. Purplemath If you are asked to simplify something like "4 + 2×3", the question that naturally arises is "Which way do I do this?

Because there are two options! " I could add first: Data Types. 1.2 - Discrete Data Types and Examples. Printer-friendly version Categorical/Discrete/Qualitative data Measures on categorical or discrete variables consist of assigning observations to one of a number of categories in terms of counts or proportions.

The categories can be unordered or ordered (see below). Counts and Proportions Counts are variables representing frequency of occurrence of an event: Number of students taking this class.Number of people who vote for a particular candidate in an election. Tutorial on the Use of Significant Figures. All measurements are approximations—no measuring device can give perfect measurements without experimental uncertainty.

By convention, a mass measured to 13.2 g is said to have an absolute uncertainty of plus or minus 0.1 g and is said to have been measured to the nearest 0.1 g. In other words, we are somewhat uncertain about that last digit—it could be a "2"; then again, it could be a "1" or a "3". A mass of 13.20 g indicates an absolute uncertainty of plus or minus 0.01 g. The objectives of this tutorial are: —Explain the concept of signficant figures. Sixth grade math practice. Arithmetic and pre-algebra. Big Picture - Personalized Learning One Student at a Time - an innovative education alternative. Mathematics and quantitative reasoning are challenging areas for many alternative schools, and Big Picture Learning (BPL) currently is undertaking an extended redesign of our curriculum and teaching practices in this area. Our approach is to bring strengthened academics to what is relevant to the student as distinct from prevailing designs that attempt to bring relevance to academics.
Ultimately, we believe our work can meld these two approaches.Click here for full prospectus. Quantitative reasoning is one of the five Big Picture Learning Goals: How do I measure or represent it? The goal is to think, learn, and perform like a mathematician: to understand numbers, to analyze uncertainty, to comprehend the properties of shapes and dimension, and to calculate how things change over time.
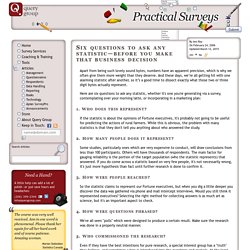
Empirical reasoning is one of the five Big Picture Learning Goals: How do I prove it? Elementary Statistics and Probability Tutorials and Problems. Statistical Literacy: From Idiosyncratic to Critical Thinking - 4.1_Watson&Callingham.pdf. Statistical Literacy @ UOW. Six questions to ask any statistic—before you make that business decision. Apart from being such lovely sound bytes, numbers have an apparent precision, which is why we often give them more weight than they deserve.

And these days, we’re all getting hit with one alarming statistic after another, so it’s a good time to dissect exactly what those two or three digit bytes actually represent. Here are six questions to ask any statistic, whether it's one you're generating via a survey, contemplating over your morning latte, or incorporating in a marketing plan: 1. Who does this represent? If the statistic is about the opinions of Fortune executives, it's probably not going to be useful for predicting the actions of rural farmers. 2. Some studies, particularly ones which are very expensive to conduct, will draw conclusions from less than 100 participants. 3. So the statistic claims to represent our Fortune executives, but when you dig a little deeper you discover the data was gathered via phone and mall intercept interviews. 4. 5. 6. RStats Resources. Statistics Tutoring Undergraduate students who need assistance with statistics homework can receive one-on-one tutoring through Missouri State University's Bear CLAW (Center for Learning and Writing).

Click here to access Bear CLAW Statistics Tutoring. Instructional Videos Tables and Calculators Click here to access: Normal Distribution TableT Distribution TableCritical Pearson's r ValuesF Distribution TableChi Square Distribution Table and CalculatorCohen's D Effect Size Calculator Notes from Previous RStats Workshops Information About RStats.