

SAMPL Guidelines 6 27 13. How do I report independent samples T-test data in APA style? Three things It’s a good idea to report three main things in an APA style results section when it comes to t-tests.
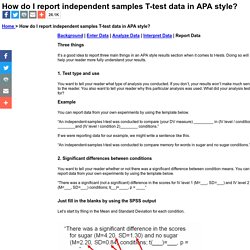
Doing so will help your reader more fully understand your results. 1. Test type and use You want to tell your reader what type of analysis you conducted. How do I report a 1-way between subjects ANOVA in APA style? Three or four things to report You will be reporting three or four things, depending on whether you find a significant result for your 1-Way Betwee Subjects ANOVA 1.
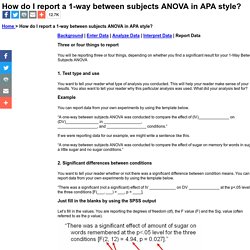
Test type and use You want to tell your reader what type of analysis you conducted. This will help your reader make sense of your results. Intro to measurement and statistics. Why Teaching Both Estimation and Accuracy is Important. When I work with elementary students, they are often confused when they reach the estimation unit, and so are their parents.
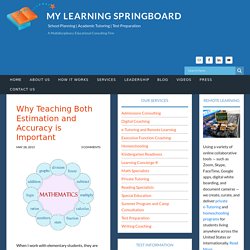
They get hung up on the skill rather than understanding why the concept is even relevant. Students prefer to find the exact answer because estimating seems like extra work and, developmentally, estimating is a challenging task for young children. According to John A. Van de Walle, a math education researcher, estimation is a higher-level skill that requires students to be able to conceptualize and mentally manipulate numbers. Misunderstood Minds . Basics of Math. Mathematics is often thought of as a subject that a student either understands or doesn't, with little in between.
In reality, mathematics encompasses a wide variety of skills and concepts. Although these skills and concepts are related and often build on one another, it is possible to master some and still struggle with others. For instance, a child who has difficulty with basic multiplication facts may be successful in another area, such as geometry. An individual student may have some areas of relative strength and others of real vulnerability. In recent years, researchers have examined aspects of the brain that are involved when children think with numbers. How to structure quantitative research questions. STEP TWO Identify the different types of variable you are trying to measure, manipulate and/or control, as well as any groups you may be interested in Whether you are trying to create a descriptive, comparative or relationship-based research question, you will need to identify the different types of variable that you are trying to measure, manipulate and/or control.
If you are unfamiliar with the different types of variable that may be part of your study, the article, Types of variable, should get you up to speed. It explains the two main types of variables: categorical variables (i.e., nominal, dichotomous and ordinal variables) and continuous variables (i.e., interval and ratio variables). It also explains the difference between independent and dependent variables, which you need to understand to create quantitative research questions. Operational definition (What is it? When is it used?)
Learning Math. Notessp2013. General Intros. Onlinestatbook's channel. Probability and statistics. Introduction to Descriptive Statistics. Variables. Variables Author(s) Heidi Ziemer Prerequisites none.
Basic Statistics: About Incidence, Prevalence, Morbidity, and Mortality - Statistics Teaching Tools - New York State Department of Health. Independent variables are the conditions within a study the experimenter directly manipulates. Independent Variables (IV) are the conditions within a study the experimenter directly manipulates.
For example, in Osborn's (1996) "Makeup causes attractiveness? " study he assigned participants to see a woman with or without makeup. So makeup was the independent variable with two levels, makeup versus no-makeup. By comparing the average rating of attractiveness of the woman with makeup to the average rating by a different group of participants who saw the woman without makeup, he could estimate how important a cause makeup (independent variable) is in effecting attractiveness ratings (dependent variable).
So the cause is makeup and the effect is attractiveness ratings. We will be calling studies like this, where the experimenter can randomly assign each participant what group to be in, a true experiment. The other major type of study is a descriptive/correlational study where the experimenter uses some pre-existing characteristic of the participants to form the groups. Variables. Reporting Statistics - Reporting_Statistics.pdf. Biostatistics - Populations. Statistical Studies in Populations In order for a study to be performed, the population must be defined.
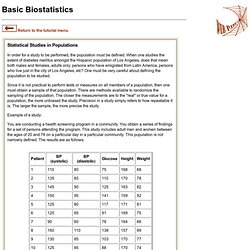
When one studies the extent of diabetes mellitus amongst the Hispanic population of Los Angeles, does that mean both males and females, adults only, persons who have emigrated from Latin America, persons who live just in the city of Los Angeles, etc? One must be very careful about defining the population to be studied. 3. Populations and samples. Populations In statistics the term "population" has a slightly different meaning from the one given to it in ordinary speech.
It need not refer only to people or to animate creatures - the population of Britain, for instance or the dog population of London. Statisticians also speak of a population of objects, or events, or procedures, or observations, including such things as the quantity of lead in urine, visits to the doctor, or surgical operations. A population is thus an aggregate of creatures, things, cases and so on. Although a statistician should clearly define the population he or she is dealing with, they may not be able to enumerate it exactly. Samples A population commonly contains too many individuals to study conveniently, so an investigation is often restricted to one or more samples drawn from it.
Sample Size. Volume 11, No. 3, Art. 8 – September 2010 Sample Size and Saturation in PhD Studies Using Qualitative Interviews Mark Mason Abstract: A number of issues can affect sample size in qualitative research; however, the guiding principle should be the concept of saturation.
Starting Statistical Analysis. Statistics might sound daunting, or it might not. Either way, after using PANDA the use of statistics should seem more practical and the basic concepts should be ready at your fingertips for future use. In order to make a smooth transition, this section will provide some statistics background that will be useful for PANDA modules such as the Two-way and Multi-way Analysis. Hope this makes things a lot easier. Reporting Statistics in APA Style. Dr. Jeffrey Kahn, Illinois State University The following examples illustrate how to report statistics in the text of a research report.
You will note that significance levels in journal articles--especially in tables--are often reported as either "p > .05," "p < .05," "p < .01," or "p < .001. " APA style dictates reporting the exact p value within the text of a manuscript (unless the p value is less than .001). Please pay attention to issues of italics and spacing. Mean and Standard Deviation are most clearly presented in parentheses: Statistical Data Types. Statistical hypothesis testing and some pitfalls.