

[Q] Contrasts for two way ANOVAs : statistics. Answering questions with data. We have arrived to the most complicated thing we are going to discuss in this class.
Unfortunately, we have to warn you that you might find this next stuff a bit complicated. You might not, and that would be great! We will try our best to present the issues in a few different ways, so you have a few different tools to help you understand the issue. What’s this so very complicated issue? Well, the first part it isn’t that complicated. What if you wanted to manipulate more than one independent variable? Let’s go through some examples of designs so can see what we are talking about. We would use a t-test for these designs, because they only have two levels. Research Methods Knowledge Base. Here, we’ll look at a number of different factorial designs.

We’ll begin with a two-factor design where one of the factors has more than two levels. Then we’ll introduce the three-factor design. Finally, we’ll present the idea of the incomplete factorial design. A 2x3 Example For these examples, let’s construct an example where we wish to study of the effect of different treatment combinations for cocaine abuse. ANOVA and the analysis of drug combination experiments. Answering questions with data. Analysis of variance: variably complex. ANOVA’s three types of estimating Sums of Squares: don’t make the wrong choice! Psych. Statistics: Two way analysis of variance (ANOVA). Analysis of Variance - Two Way Practice Problems (Answers) Homework I.
Introduction In addition to being able to analyze an experiment with one Independent Variable (IV), the ANOVA can be used for factorial designs (or designs which employ more than one IV). Note that, in this context, an IV is often referred to as a factor. Let's look at these design issues in more detail with a concrete example and then consider the unique information that this design provides. One way rm anova DE300. Interaction. Two Fungal Species Cooperate to Synthesize an Antibiotic. Microbiologists often study microbes in isolation.

In the scientific vernacular, this is called "pure culture. " While this is necessary to understand how individual microbes work, the trouble with this approach is that microbes do not live by themselves in the natural environment. Instead, they live in communities with multiple other species, cooperating and competing in order to survive. As a result, microbes can behave very differently in the environment compared to the artificial solitude of the laboratory. This insight has helped spur the field of microbial ecology, which studies microbial interactions with each other and the environment.
Factorial ANOVA - Analysing Multiple Factors - Analysis of Variance. Power and Sample Size. Back to the Table of Contents Lesson Overview The role of sample size in the power of a statistical test must be considered before we go on to advanced statistical procedures such as analysis of variance/covariance and regression analysis.
One can select a power and determine an appropriate sample size beforehand or do power analysis afterwards. However, power analysis is beyond the scope of this course and predetermining sample size is best. Sample Size Importance Although crucial, the simple question of sample size has no definite answer due to the many factors involved. Two-Way ANOVA. One between subjects factor and one within subjects factor.
ANOVA for main and interaction effects Example 1: A new drug is tested on a random sample of insomniacs: 7 young people (20-40 yrs), 7 middle aged people (40-60 yrs) and 7 older people (60+ yrs).
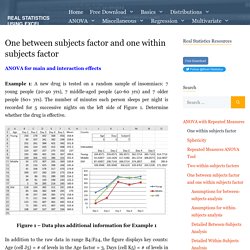
The number of minutes each person sleeps per night is recorded for 5 successive nights in the left side of Figure 1. Determine whether the drug is effective. Figure 1 – Data plus additional information for Example 1 In addition to the raw data in range B4:F24, the figure displays key counts: Age (cell J5) = # of levels in the Age factor = 3, Days (cell K5) = # of levels in Days factor = 5 and Subject (cell L5) = # of subjects in each Age group = 7. Marginal means of all the intersections of Age × Days are given in range J9:N11, along with their sums. How to Interpret the Results of A Two Way ANOVA (Factorial) PIP. Interactions Think back to the introduction.
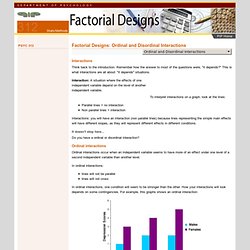
Remember how the answer to most of the questions were, "it depends? " This is what interactions are all about: "it depends" situations. Interaction: A situation where the effects of one independent variable depend on the level of another independent variable. To interpret interactions on a graph, look at the lines: Parallel lines = no interaction Non parallel lines = interaction Interactions: you will have an interaction (non parallel lines) because lines representing the simple main effects will have different slopes, as they will represent different effects in different conditions.
It doesn't stop here... Do you have a ordinal or disordinal interaction? Ordinal interactions Ordinal interactions occur when an independent variable seems to have more of an effect under one level of a second independent variable than another level. In ordinal interactions: lines will not be parallel lines will not cross. Microsoft Word - _1 page.doc - 419. PSY2174_S11_Slides08Multifactorial.key - PSY2174_S11_Slides08Multifactorial.pdf. Factorial ANOVA - Factorial ANOVA.pdf. Chapter 12.pdf. 2x2 Mixed ANOVA. 2x2 Mixed Factorial Design Background information you need to know to understand the 2x2 mixed analysis is covered in the PsychConnections commentary "Within-Subjects Designs" and "2x2 Between Subjects Designs".
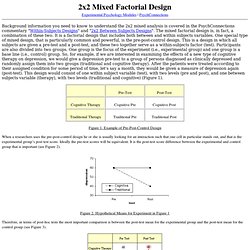
The mixed factorial design is, in fact, a combination of these two. It is a factorial design that includes both between and within subjects variables. One special type of mixed design, that is particularly common and powerful, is the pre-post-control design. This is a design in which all subjects are given a pre-test and a post-test, and these two together serve as a within-subjects factor (test).
Figure 1. When a researchers uses the pre-post-control design he or she is usually looking for an interaction such that one cell in particular stands out, and that is the experimental group’s post test score. Figure 2. Figure 3. Figure 4. Microsoft Word - Mixed ANOVA (2012).docx - mixed.pdf. 2x2 Mixed ANOVA. Microsoft Word - Mixed ANOVA (2012).docx - mixed.pdf. Repeated Measures Anova. SAS LibraryRepeated Measures ANOVA Using SAS PROC GLM This page was developed by the Consulting group of the Division of Statistics and Scientific Computing at the University of Texas at Austin.
We thank them for permission to distribute it via our web site. 31 July 1997 Usage Note: Stat-40 Copyright 1995-1997, ACITS, The University of Texas at Austin Statistical Services, 475- Originally available online at: Repeated Measures ANOVA Using SAS PROC GLM This usage note describes how to run a repeated measures analysis of variance (ANOVA), including a between-subjects variable, using the SAS GLM procedure. You should already know how to write a SAS program to read an external data file and run SAS procedures using the data.
Stats: Two-Way ANOVA. The two-way analysis of variance is an extension to the one-way analysis of variance.
There are two independent variables (hence the name two-way). Assumptions The populations from which the samples were obtained must be normally or approximately normally distributed. The samples must be independent. Assumptions of the Factorial ANOVA » Statistics Solutions. The factorial ANOVA has a several assumptions that need to be fulfilled – (1) interval data of the dependent variable, (2) normality, (3) homoscedasticity, and (4) no multicollinearity. Furthermore similar to all tests that are based on variation (e.g. t-test, regression analysis, and correlation analyses) the quality of results is stronger when the sample contains a lot of variation – i.e., the variation is unrestricted and not truncated. Firstly, the factorial ANOVA requires the dependent variable in the analysis to be of metric measurement level (that is ratio or interval data) the independent variables can be nominal or better.
If the independent variables are not nominal or ordinal they need to be grouped first before the factorial ANOVA can be done. Microsoft PowerPoint - bg-wg.ppt - bg-wg.pdf. Factorial Design Analysis. Repeated Measures ANOVA - Understanding a Repeated Measures ANOVA. Introduction Repeated measures ANOVA is the equivalent of the one-way ANOVA, but for related, not independent groups, and is the extension of the dependent t-test.
A repeated measures ANOVA is also referred to as a within-subjects ANOVA or ANOVA for correlated samples. All these names imply the nature of the repeated measures ANOVA, that of a test to detect any overall differences between related means. There are many complex designs that can make use of repeated measures, but throughout this guide, we will be referring to the most simple case, that of a one-way repeated measures ANOVA. Factorial ANOVA (including two-way ANOVA) Factorial ANOVA (including two-way ANOVA) 1 Continuous Dependent Variable with normal distribution 2 or more Categorical Independent Variables. MANOVA What is it?