

MANOVA What is it? Factorial ANOVA (including two-way ANOVA) Assumptions of the Factorial ANOVA » Statistics Solutions. The factorial ANOVA has a several assumptions that need to be fulfilled – (1) interval data of the dependent variable, (2) normality, (3) homoscedasticity, and (4) no multicollinearity.
Furthermore similar to all tests that are based on variation (e.g. t-test, regression analysis, and correlation analyses) the quality of results is stronger when the sample contains a lot of variation – i.e., the variation is unrestricted and not truncated. Firstly, the factorial ANOVA requires the dependent variable in the analysis to be of metric measurement level (that is ratio or interval data) the independent variables can be nominal or better. If the independent variables are not nominal or ordinal they need to be grouped first before the factorial ANOVA can be done. Secondly, the factorial analysis of variance assumes that the dependent variable approximates a multivariate normal distribution. In other terms the factorial ANOVA should not have any between-factor effects.
How to Interpret the Results of A Two Way ANOVA (Factorial) Introduction to ANOVA / MANOVA. A general introduction to ANOVA and a discussion of the general topics in the analysis of variance techniques, including repeated measures designs, ANCOVA, MANOVA, unbalanced and incomplete designs, contrast effects, post-hoc comparisons, assumptions, etc.

For related information, see also Variance Components (topics related to estimation of variance components in mixed model designs), Experimental Design/DOE (topics related to specialized applications of ANOVA in industrial settings), and Repeatability and Reproducibility Analysis (topics related to specialized designs for evaluating the reliability and precision of measurement systems). See also, General Linear Models and General Regression Models; to analyze nonlinear models, see Generalized Linear Models. Basic Ideas. Difference between ANOVA and MANOVA? Thanks Vagelas, Explanation and provided links are very useful and helpful Dear Abdul, “ANOVA” stands for “Analysis of Variance” while “MANOVA” stands for “Multivariate Analysis of Variance.”The ANOVA method includes only one dependent variable while the MANOVA method includes multiple, dependent variables.ANOVA uses three different models for experimentations; random-effect, fixed-effect, and multiple-effect methods to determine the differences in means which is its main objective while MANOVA determines if the dependent variables get significantly affected by changes in the independent variables.

Further reading Dear Dr Muhammad, Repeated-measures ANOVA. Also known as within-subjects design, theses tests are used when each subject is measured multiple times.
Different treatments may applied to each subject over time, or to groups of subjects in a uniform way. Similar to paired t-tests, these tests increase the power of the analysis by accounting for the idiosyncratic differences between subjects. The following conditions make a study appropriate for repeated-measures ANOVA: Several measurements taken on each subject over time Distinct treatments applied either to each subject at different times or to groups of subjects at a single time or throughout the study More than two time points One or more continuous response variables.
Advanced ANOVA/MANOVA. What is MANOVA?
[edit] Developed as a theoretical construct by Samual S. Wilks in 1932 (Biometrika).An extension of univariate ANOVA procedures to situations in which there are two or more related dependent variables (ANOVA analyses only a single DV at a time). DVs should be correlated (but not overly so; otherwise they should be combined) or conceptually related.The MANOVA procedure identifies (inferentially) whether: Different levels of the IVs have a significant effect on a linear combination of each of the DVsThere are interactions between the IVs and a linear combination of the DVs.There are significant univariate effects for each of the DVs separately. Example[edit] MANOVAHowTo. MANOVA Basic Concepts. Univariate case One-way ANOVA investigates the effects of a categorical variable (the groups, i.e. independent variables) on a continuous outcome (the dependent variable).
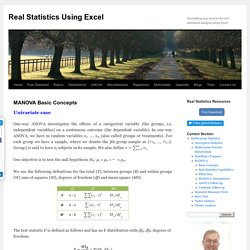
In one-way ANOVA, we have m random variables x1, …, xm (also called groups or treatments). For each group we have a sample, where we denote the jth group sample as { }. Group j is said to have nj subjects in its sample. Our objective is to test the null hypothesis H0: μ1 = μ2 = ⋯ = μm. MANOVA Assumptions. In order to use MANOVA the following assumptions must be met: Observations are randomly and independently sampled from the populationEach dependent variable has an interval measurementDependent variables are multivariate normally distributed within each group of the independent variables (which are categorical)The population covariance matrices of each group are equal (this is an extension of homogeneity of variances required for univariate ANOVA) These assumptions are similar to those for the Hotelling’s T-square test (see Hotelling’s T-square for Two samples).
In particular we test for multivariate normality and homogeneity of covariance matrices in a similar fashion. Multivariate normality: If the samples are sufficiently large (say at least 20 elements for each dependent × independent variable combination), then the Multivariate Central Limit Theorem holds and we can assume the multivariate normality assumption holds. MANOVA. One-way MANOVA in SPSS Statistics - Step-by-step procedure with screenshots. Introduction The one-way multivariate analysis of variance (one-way MANOVA) is used to determine whether there are any differences between independent groups on more than one continuous dependent variable.
In this regard, it differs from a one-way ANOVA, which only measures one dependent variable. For example, you could use a one-way MANOVA to understand whether there were differences in the perceptions of attractiveness and intelligence of drug users in movies (i.e., the two dependent variables are "perceptions of attractiveness" and "perceptions of intelligence", whilst the independent variable is "drug users in movies", which has three independent groups: "non-user", "experimenter" and "regular user"). Manova1. Free Download. Click on an icon below for a free download of either of the following files.
Real Statistics Resource Pack: contains a variety of supplemental functions and data analysis tools not provided by Excel. These complement the standard Excel capabilities and make it easier for you to perform the statistical analyses described in the rest of this website. Real Statistics Examples Workbooks: four Excel workbooks can be downloaded for free, which contain worksheets that implement the various tests and analyses described in the rest of this website. Two files cover univariate tests and the other two cover multivariate tests and time series analysis. Real Statistics Analysis using Excel books: Eventually you will be able to purchase books that will contain information that is similar to what you find on the website.
Statistically Significant Consulting. Click on the Audio Buttons to Hear a Summary of How I Work with Doctoral Candidates.

Multivariate Analysis and MANOVA The MANOVA (multivariate analysis of variance) is a type of multivariate analysis used to analyze data that involves more than one dependent variable at a time. MANOVA allows us to test hypotheses regarding the effect of one or more independent variables on two or more dependent variables. A MANOVA analysis generates a p-value that is used to determine whether or not the null hypothesis can be rejected. Sage: MANOVA. SPSS Data Analysis Examples: One-way Manova. SPSS Data Analysis Examples One-way Manova Version info: Code for this page was tested in IBM SPSS 20. MANOVA is used to model two or more dependent variables that are continuous with one or more categorical predictor variables.
Please note: The purpose of this page is to show how to use various data analysis commands. It does not cover all aspects of the research process which researchers are expected to do. In particular, it does not cover data cleaning and checking, verification of assumptions, model diagnostics or potential follow-up analyses. What is Multivariate Statistical Analysis? Multivariate statistical analysis refers to multiple advanced techniques for examining relationships among multiple variables at the same time. Multivariate Analysis of Variance MANOVA: NCSS.