

AI Is Transforming Google Search. The Rest of the Web Is Next. Yesterday, the 46-year-old Google veteran who oversees its search engine, Amit Singhal, announced his retirement.
And in short order, Google revealed that Singhal’s rather enormous shoes would be filled by a man named John Giannandrea. On one level, these are just two guys doing something new with their lives. EU accuses Samsung of patent abuse in Apple lawsuits. 21 December 2012Last updated at 14:29 ET Samsung had attempted to force some of Apple's devices off store shelves in Europe EU competition regulators probing Samsung's patent litigation tactics believe the firm has abused its position.

From Apple to polka dots, technology can help supply chains react. 10 December 2012Last updated at 21:38 ET By Dave Lee Technology reporter, BBC News One appearance from the Duchess of Cambridge sent one high street retailer into a supply chain spin In recent months, worries over Apple's future have been reflected in the company's share price, which has begun to fall from the dizzying heights of just over $700 (£436) to around $500 today.
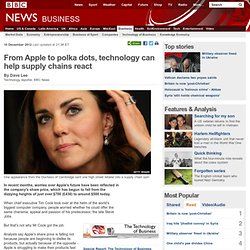
When chief executive Tim Cook took over at the helm of the world's biggest computer company, people worried whether he could offer the same charisma, appeal and passion of his predecessor, the late Steve Jobs. But that's not why Mr Cook got the job. Analysts say Apple's share price is falling not because people are beginning to dislike its products, but actually because of the opposite - Apple is struggling to make their products fast enough. Amazon. The Rise of Visual Browsing. This time last year at the annual TED conference, Microsoft Live Labs demoed an immersive media-browsing tool that literally caused gasps in the audience.

Seadragon/Photosynth is exactly the kind of ’3-D web’ experience people were hyping in the late 1990s, along with VRML (Virtual Reality Modeling Language), as though they were poised to go mainstream. Instead, many users rejected the over-use of tools like Flash, while Google’s simple text-based results became the gold standard. Discussion of ‘visual browsing’ has heated up again, though. It will be interesting to see what kinds of interactions the public adapts to and which they reject.
Data Visualization Software. Xiaoji Chen's Design Weblog » Power Chart of Chinese Provinces. Economist just posts an interactive visualization Chinese Equivalents on their website.
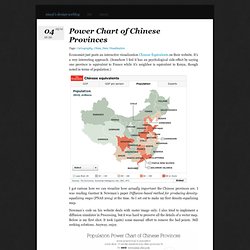
It’s a very interesting approach. (Somehow I feel it has an psychological side-effect by saying one province is equivalent to France while it’s neighbor is equivalent to Kenya, though noted in terms of population.) Curing. Health InfoScape. Xiaoji Chen's Design Weblog » Health Infoscape. Senseable City Lab partnered with GE to create new ways of understanding human health.
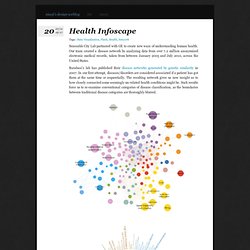
Our team created a disease network by analyzing data from over 7.2 million anonymized electronic medical records, taken from between January 2005 and July 2010, across the United States. Barabasi’s lab has published their disease networks generated by genetic similarity in 2007. In our first attempt, diseases/disorders are considered associated if a patient has got them at the same time or sequentially. Diagram Layout Software. Tom Sawyer Layout is a Software Development Kit (SDK) that provides nested drawing data models and layout, labeling, and routing technology for applications that have their own graphical framework.
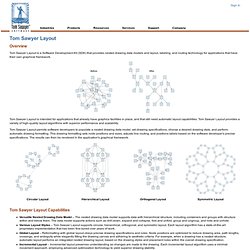
Tom Sawyer Layout is intended for applications that already have graphics facilities in place, and that still need automatic layout capabilities. Tom Sawyer Layout provides a variety of high-quality layout algorithms with superior performance and scalability. Tom Sawyer Layout permits software developers to populate a nested drawing data model, set drawing specifications, choose a desired drawing style, and perform automatic drawing formatting.
Tools - WikiViz. Datasets - Gephi:Wiki. Gephi sample datasets, in various format (GEXF, GDF, GML, NET, GraphML, DL, DOT).
Feel free to add new datasets. Be sure you cite original authors. Supported graph formats are described here. Note that Gephi can open these files without the need to be unzipped. Web and Internet [GEXF] EuroSiS web mapping study: Mapping interactions between Science in Society actors on the Web of 12 European countries. [GML] Internet: a symmetrized snapshot of the structure of the Internet at the level of autonomous systems, reconstructed from BGP tables posted by the University of Oregon Route Views Project. Social networks [GML] Les Miserables: coappearance weighted network of characters in the novel Les Miserables.
[GEXF] Hypertext 2009 dynamic contact network: contact network during the Hypertext 2009 conference. Features. Gephi is a tool for data analysts and scientists keen to explore and understand graphs. Like Photoshop™ but for graph data, the user interacts with the representation, manipulate the structures, shapes and colors to reveal hidden patterns. The goal is to help data analysts to make hypothesis, intuitively discover patterns, isolate structure singularities or faults during data sourcing. It is a complementary tool to traditional statistics, as visual thinking with interactive interfaces is now recognized to facilitate reasoning. This is a software for Exploratory Data Analysis, a paradigm appeared in the Visual Analytics field of research. Real-time visualization Profit from the fastest graph visualization engine to speed-up understanding and pattern discovery in large graphs.
Layout. Navigator. NodeXL Graph Gallery. 12 Most Strangely Specific Search Engines. Google is great, but sometimes we need to narrow the field even more. I keep the following 12 search engines handy whenever I am working on a project. 1. Creative Commons Creative Commons has a page set up for all types of searches; audio, image, and video. Content Curation, Real-Time News Curation, Newsma...
The future of LinkedIn and the economic graph. Resultly.