

Quadrigram. Data visualization. Online Business Optimization by Omniture. D3.js - Data-Driven Documents. The SHOGUN Machine Learning Toolbox. Demo displaying the performance of SVR in Shogun.
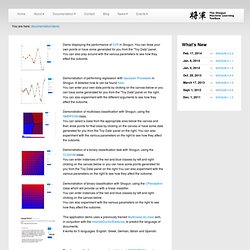
You can draw your own points or have some generated for you from the "Toy Data" panel.You can also play around with the various parameters to see how they effect the outcome. Demonstration of performing regression with Gaussian Processes in Shogun. A detailed how-to can be found here. You can enter your own data points by clicking on the canvas below or you can have some generated for you from the "Toy Data" panel on the right.
You can also experiment with the different arguments to see how they affect the outcome. Demonstration of multiclass classification with Shogun, using the GMNPSVM class. Demonstration of binary classification with Shogun, using the CPerceptron class which will provide us with a linear classifier.You can enter instances of the red and blue classes by left and right-clicking on the canvas below.You can also experiment with the various parameters on the right to see how they affect the outcome. Microsoft 3rd Generation Photosynth. Microsoft this morning lifted the veil on the next generation of Photosynth, its 3D image technology, with the release of a technical preview of the new Photosynth. This is the third generation of the technology, and is now recommended for those with D-SLR or point-and-shoot cameras, says Microsoft.
The prior two versions of Microsoft Photosynth, which offer the original synths and stitched panoramas, are still available on the main Photosynth website. Meanwhile, the updated technology now supports four basic experiences: “spin,” “panorama,” “walk” and “wall.” As their respective names describe, each offers a different kind of 3D image viewing experience – a spin around an object as small as a teacup or as large as a glacial peak, Microsoft explains, a panoramic view, a walk – like down a path through the woods, for example – or a slide across a scene.
Into the Western Cwm by GlacierWorks.org on Photosynth Edinburgh Castle walk by David on Photosynth. Processing.js. Incremental Delaunay Triangulationby Jeonggyu Lee An interactive implementation of incremental Delaunay Triangulation algorithm.

My Life Aquaticby David Leibovic, Sunah Suh A shared aquarium Source code Circle of Fifthsby Shelley Marshall Create, transpose, and change a chord progression by using the circle of fifths, and play the progression. 2011 Advent Calendarby Nikolaus Gradwohl. Data Visualization Tools. Google Earth Pro. Make your maps discoverable to the world - Google Maps Engine Help. ¡Publica hoy mismo tus mapas en la Galería de Google Maps!
Nuestra visión es ofrecer un acceso más sencillo a los datos geoespaciales del mundo. Muestra tus mapas en la Galería de Google Maps para que consumidores, votantes u otros interesados puedan encontrar fácilmente el contenido de tus mapas online. Estos son algunos ejemplos. La Galería de Google Maps está abierta a organizaciones que ofrezcan contenido en pro del bien público. Dichas organizaciones podrán aprovechar las herramientas de nivel empresarial que ofrece Google para crear mapas personalizados, comunicar información crítica, aumentar la conciencia social respecto a ciertos problemas y educar a personas de todo el mundo.
Para solicitar la participación en el programa y publicar tus mapas en la Galería de Maps, completa este formulario. ¡Gracias por tu interés! El equipo de la Galería de Google Maps. VisTrails. From VisTrailsWiki This is the official website for VisTrails, an open-source scientific workflow and provenance management system that supports data exploration and visualization.
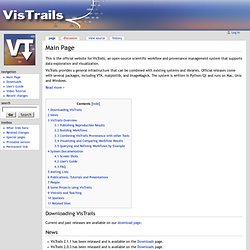
VisTrails provides a general infrastructure that can be combined with existing systems and libraries. Official releases come with several packages, including VTK, matplotlib, and ImageMagick. The system is written in Python/Qt and runs on Mac, Unix and Windows. Read more > Downloading VisTrails Current and past releases are available on our download page. Point Cloud Library (PCL) Whether you've just discovered PCL or you're a long time veteran, this page contains links to a set of resources that will help consolidate your knowledge on PCL and 3D processing.
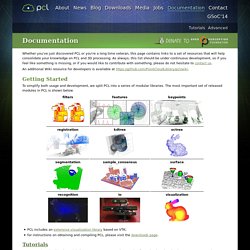
As always, this list should be under continuous development, so if you feel like something is missing, or if you would like to contribute with something, please do not hesitate to contact us. An additional Wiki resource for developers is available at Getting Started To simplify both usage and development, we split PCL into a series of modular libraries. The most important set of released modules in PCL is shown below. Tutorials Our comprehensive list of tutorials for PCL, covers many topics, ranging from simple Point Cloud Input/Output operations to more complicated applications that include visualization, feature estimation, segmentation, etc.
Advanced Topics API documentation. Data Visualization Tools. 3D. WebGL Demo Repo. Demos - Cesium - WebGL Virtual Globe and Map Engine. SUNSHINE - "Smart UrbaN ServIces for Higher eNergy Efficiency" delivers innovative digital services, interoperable with existing geographic web-service infrastructures, supporting improved energy efficiency at the urban and building level.
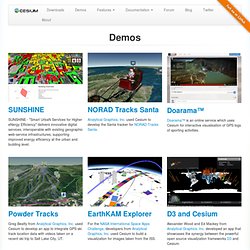
NORAD Tracks Santa Analytical Graphics, Inc. used Cesium to develop the Santa tracker for NORAD Tracks Santa. Doarama™ Doarama™ is an online service which uses Cesium for interactive visualisation of GPS logs of sporting activities. OpenFrameworks. Gephi, an open source graph visualization and manipulation software. GraphViz Gallery.