

Patterns - An Optimization Anecdote. Warning This page stays here for historical reasons and it may contain outdated or incorrect information.
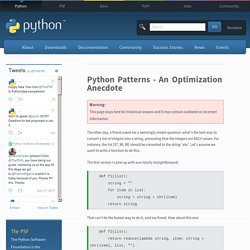
The other day, a friend asked me a seemingly simple question: what's the best way to convert a list of integers into a string, presuming that the integers are ASCII values. For instance, the list [97, 98, 99] should be converted to the string 'abc'. Let's assume we want to write a function to do this. The first version I came up with was totally straightforward: def f1(list): string = "" for item in list: string = string + chr(item) return string That can't be the fastest way to do it, said my friend. Def f2(list): return reduce(lambda string, item: string + chr(item), list, "") This version performs exactly the same set of string operations as the first one, but gets rid of the for loop overhead in favor of the faster, implied loop of the reduce() function.
Vbench. CodeCoverage. This page discusses code coverage in general.
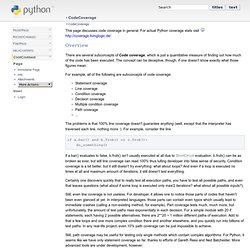
For actual Python coverage stats visit Overview There are several subconcepts of Code coverage, which is just a quantitative measure of finding out how much of the code has been executed. The concept can be deceptive, though, if one doesn't know exactly what those figures mean. Code Coverage Analysis. This paper gives a complete description of code coverage analysis (test coverage analysis), a software testing technique. By Steve Cornett. Copyright © Bullseye Testing Technology 1996-2011. All rights reserved. Redistribution in whole or in part is prohibited without permission. Do not copy any part of this document without permission. Contents Introduction. Coverage.py. Created 24 May 2009, last updated 12 December 2013 Coverage.py is a tool for measuring code coverage of Python programs.
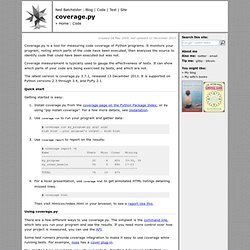
It monitors your program, noting which parts of the code have been executed, then analyzes the source to identify code that could have been executed but was not. Coverage measurement is typically used to gauge the effectiveness of tests. Blog. PyCon 2014 is over, and as usual, I loved every minute.

There are a huge number of people that I know there, and about 5 different sub-communities that I feel an irrationally strong attachment to. Some highlights: I gave a talk entitled Getting Started Testing, which people seemed to like, though if you are interested, I can point out the five places I messed up...Jenny turned me into a cute illustration, which was a fun surprise.I was super-proud of Michelle Fulwood, who has been working on an Arabic learning tool at Boston Python project nights, and always demurred when I brought up the idea of her talking about it. But Sunday morning, she gave a kick-ass lightning talk about it! My head is still spinning from the high-energy four days I've had, I'm sure I'm leaving out an important high point. (Senzala digital's archive) Easy-to-use Python test coverage tool.
I had written a basic test routine for Luca, mycurrent pet project, while I felt the need of coverage statistics, to see how effective were thetests written so far.
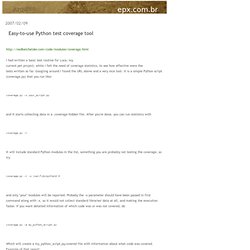
Googling around I found the URL above and a very nice tool. It is a simple Python script (coverage.py) that you run like: coverage.py -x your_script.py and it starts collecting data in a .coverage hidden file. After you're done, you can run statistics with. Profiling - How can you profile a Python script. (re)announcing statprof, a statistical profiler for Python. Back in 2005, Andy Wingo wrote a neat little statistical profiler named statprof that promptly disappeared into obscurity.
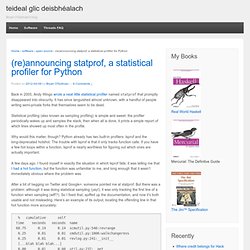
It has since languished almost unknown, with a handful of people writing semi-private forks that themselves seem to be dead. Statistical profiling (also known as sampling profiling) is simple and sweet: the profiler periodically wakes up and samples the stack, then when all is done, it prints a simple report of which lines showed up most often in the profile. Why would this matter, though? Python already has two built-in profilers: lsprof and the long-deprecated hotshot. The trouble with lsprof is that it only tracks function calls. A few days ago, I found myself in exactly the situation in which lsprof fails: it was telling me that I had a hot function, but the function was unfamiliar to me, and long enough that it wasn’t immediately obvious where the problem was. The Python Profilers — Python v3.0.1 documentation. Copyright © 1994, by InfoSeek Corporation, all rights reserved.
Written by James Roskind. Permission to use, copy, modify, and distribute this Python software and its associated documentation for any purpose (subject to the restriction in the following sentence) without fee is hereby granted, provided that the above copyright notice appears in all copies, and that both that copyright notice and this permission notice appear in supporting documentation, and that the name of InfoSeek not be used in advertising or publicity pertaining to distribution of the software without specific, written prior permission. This permission is explicitly restricted to the copying and modification of the software to remain in Python, compiled Python, or other languages (such as C) wherein the modified or derived code is exclusively imported into a Python module.
Introduction to the profilers.