Let's focus Export - Mapping Tools Radar visual literacy.pos
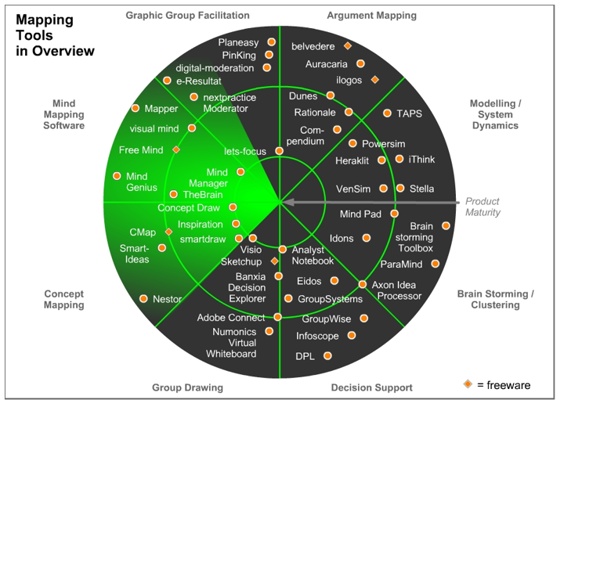
http://www.visual-literacy.org/pages/maps/mapping_tools_radar/radar.html
MODULE 2
La prise de notes Le matériel En matière de prise de notes, il est souvent conseillé d'utiliser des feuilles plutôt que des cahiers.
Scribblar - Free Interactive Online Whiteboard
Abréviations pour la prise de
La manière de prendre des notes est personnelle et n’est pas soumise à des règles strictes. L’important est d’écrire rapidement et de pouvoir s’y retrouver pour que le contenu des discussions soit reproduit le plus fidèlement possible. La personne appelée à prendre des notes régulièrement développera avec le temps son propre code d’abréviations et de signes. Si certaines abréviations respectent les règles habituelles d’abrègement, d’autres peuvent s’en écarter quelque peu. Par exemple, si la règle pour abréger c’est-à-dire exige les points et les traits d’union (c.
Mind Mapping - Create Mind Maps online
Collect, curate and share your ideas, inspirations, and projects!
Related:
