

Making a reveal.js presentation with org-reveal. I’m currently working on putting together the presentation for my thesis defense and like all other things I wanted to put it together inside Emacs.
I had heard of reveal.js and wanted to give it a shot for a while, and fortunately someone made org-reveal which allows exporting an org-mode file to a reveal.js presentation. Here’s how I put together my presentation. Exporting a Google Spreadsheet as JSON. I frequently use Google Spreadsheets as a lightweight database, by setting up some columns, encouraging my colleagues to update it, and subscribing to notifications of changes.
Then I export the spreadsheet as JSON and update a json file in our codebase. Sometimes I also just use the jsonp output of a published spreadsheet, but if I'm worried about performance or the information getting mis-updated, then I'll use the export-and-update approach. In order to export it as JSON, I used to use a Google Spreadsheets Gadget but now that those are deprecated, I use a Google Apps Script. Here are the steps for using the script: Create a new spreadsheet, and put your data in columns.
Microsoft's Dope New Tool Is Like Autocomplete for Drawing. New York’s LaGuardia Airport, long derided for its shoddy terminals and chronic travel delays, will be torn down and rebuilt.

New York Governor Andrew M. Cuomo says the new, modern airport will rival the world’s best airports when it’s up and running in 2021. Cuomo unveiled plans for the new La Guardia at a luncheon in New York on Monday, along with Vice President Joe Biden. The renderings, presented by real estate developer Daniel R. Tishman, show a single terminal that will replace the four existing disjointed terminals built in the mid-20th century. Cuomo’s announcement doesn’t explicitly address whether the existing La Guardia will need to shut down during construction, but the development will happen in two phases, starting in 2016. Make Presentations Engaging and Memorable with the "1, 2... 4! Rule" Find the Perfect Color Combos With This Addictive App. There’s no way Josef Albers could’ve known, way back in 1963, how easy it eventually would become to make a color palette.

The revered Bauhaus teacher, whose book The Interaction of Color taught a generation of artists and designers the intricacies of color relationships, likely would be stunned to learn that you can create a perfectly good palette with a tap of your keyboard’s space bar. No, really. It’s that simple. “The process of creating a color scheme should be easy,” says Fabrizio Bianchi. “It should be like brainstorming.” Bianchi created Coolors, a web and iOS app that lets you generate an infinite number of color palettes by tapping your keyboard like a button on a slot machine.
Bianchi began working on Coolors out of a personal frustration. Design tools like Adobe Kuler’s color wheel, while simple in appearance, leave nearly every aesthetic choice up to the user. Beamer - Animation in PDF presentations, without Adobe Reader? View topic - How to include animated GIF in LaTeX / PDF. GeoGebra allows exporting animated GIF images but does not export the Protocols of Construction, the ide of this post is how to include GIF and animated Construction Protocols in LaTeX.Animated GIFFor include animated GIFs Need ImageMagick program and one GIF animated, for this example we use the picture hypo_hypotrochoid_001.gif from viewtopic.php?
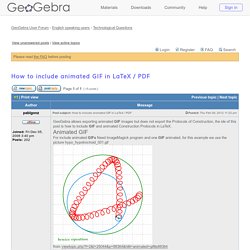
F=2&t=25044&p=88364&hilit=animated+gif#p88364Now follow steps1. Create a directory called test and copy hypo_hypotrochoid_001.gif2.The following is convert the image into separate files, we have two casesa) For Latex users (latex>dvisps>ps2pdf) open a command prompt, move to the test directory and enter the following line Code: Pow Toon. Pow Toon est un service en ligne qui permet de créer ses propres vidéos animées. Présenter autrement : les alternatives à Powerpoint - Airmis.
Pour la plupart des personnes travaillant en entreprise, l’utilisation du logiciel Microsoft Powerpoint va de soi.

Présent sur la plupart des ordinateurs de bureau, considéré comme l’outil standard de présentation, il est difficile d’exprimer et de partager la moindre analyse sans s’appuyer dessus. C’est le format de nos supports de réunion, de nos livrables, de nos lancements et clôtures de projets – personnels ou professionnels. Cependant, dans un cadre moins formel ou dans un contexte de travail favorable, il arrive que nous ayons la possibilité d’utiliser d’autres outils pour exprimer différemment des idées et mieux capter l’attention de notre auditoire.
Timemap - Javascript library to help use a SIMILE timeline with online maps including Google, OpenLayers, and Bing. Timemap.js is a Javascript library to help use online maps, including Google, OpenLayers, and Bing, with a SIMILE timeline.
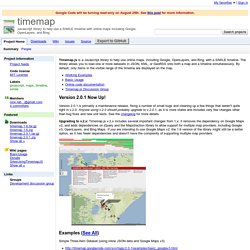
The library allows you to load one or more datasets in JSON, KML, or GeoRSS onto both a map and a timeline simultaneously. By default, only items in the visible range of the timeline are displayed on the map. Version 2.0.1 Now Up! A lightweight JavaScript graph drawing library. Data Visualization for the Web. D3.js - Data-Driven Documents.
Pgfplots.sourceforge.net/gallery.html. The following graphics have been generated with the LaTeX Packages PGFPlots and PGFPlotsTable.
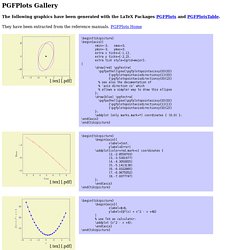
They have been extracted from the reference manuals. PGFPlots Home [.tex] [.pdf] \begin{tikzpicture} \begin{axis}[ xmin=-3, xmax=3, ymin=-3, ymax=3, extra x ticks={-1,1}, extra y ticks={-2,2}, extra tick style={grid=major}, ] \draw[red] \pgfextra{ \pgfpathellipse{\pgfplotspointaxisxy{0}{0}} {\pgfplotspointaxisdirectionxy{1}{0}} {\pgfplotspointaxisdirectionxy{0}{2}} % see also the documentation of % 'axis direction cs' which % allows a simpler way to draw this ellipse }; \draw[blue] \pgfextra{ \pgfpathellipse{\pgfplotspointaxisxy{0}{0}} {\pgfplotspointaxisdirectionxy{1}{1}} {\pgfplotspointaxisdirectionxy{0}{2}} }; \addplot [only marks,mark=*] coordinates { (0,0) }; \end{axis} \end{tikzpicture} [.tex] [.pdf] Animation suites récurrentes. The Body Language Infographic. Raphaël—JavaScript Library. MathJax. Hakimel/reveal.js.
View topic - How to include animated GIF in LaTeX / PDF. GeoGebra allows exporting animated GIF images but does not export the Protocols of Construction, the ide of this post is how to include GIF and animated Construction Protocols in LaTeX.Animated GIFFor include animated GIFs Need ImageMagick program and one GIF animated, for this example we use the picture hypo_hypotrochoid_001.gif from viewtopic.php?
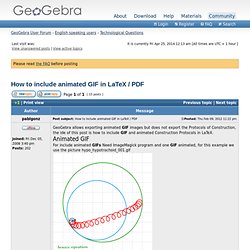
F=2&t=25044&p=88364&hilit=animated+gif#p88364Now follow steps1. Create a directory called test and copy hypo_hypotrochoid_001.gif2.The following is convert the image into separate files, we have two casesa) For Latex users (latex>dvisps>ps2pdf) open a command prompt, move to the test directory and enter the following line Code: convert hypo_hypotrochoid_001.gif -coalesce animate_%d.eps then create the directory imgeps and copy ALL pictures in this.b) For pdfLatex users (xelatex,lualatex) open a command prompt, move to the test directory and enter the following line convert hypo_hypotrochoid_001.gif -coalesce animate_%d.pdf.