

13 Chart and Graph plotting javascript plugins There are more and more Javascript chart and graph plotting solutions are being released and available for free online. I work on a complicated graph for a website before, we used highchart as the solution, during that time, there isn't a lot of plugins to choose from, but now, we can easily find many very capable charting libraries. Personally, the rise of this kind of plugins are due to: Flash used to be the best solution, but everyone is moving on from there.Modern browsers and powerful computing make it possible to render live data easily.Maturity of different technologies in drawing vector: VML, SVG and Canvas. Of course, you need to carefully choose one that fit your requirements. As we mentioned before, they use various technologies, as a result, some plugins support canvas only which require modern browsers, and other combine multiple technologies altogether so it able to work on different platforms and older browsers.
Cytoscape.js This is how easy it is to get started with Cytoscape.js (this code creates the instance you see on the bottom-right: About Cytoscape.js is an open-source graph theory library written in JavaScript. You can use Cytoscape.js for graph analysis and visualisation. Cytoscape.js allows you to easily display and manipulate rich, interactive graphs.
A Javascript library that makes working with the HTML5 Canvas element easy. Recent Updates Follow @CreateJS November 2014 Travel Visa Inequality - How fair are travel visas distributed ? (ksenia) Travel Visa Inequality This project is a personal project by Christian Laesser. A vacation in Thailand made me curious about how equal travel visas are distributed between different countries. My intention of this project was to raise awareness for existing inequalities between different countries knowing that this problem is only one example of inequality around the globe. flotr2 Introduction Flotr2 is a library for drawing HTML5 charts and graphs. It is a branch of flotr which removes the Prototype dependency and includes many improvements. Processing.js Demos below! As a sort-of reverse birthday present I’ve decided to release one of my largest projects, in recent memory. This is the project that I’ve been alluding to for quite some time now: I’ve ported the Processing visualization language to JavaScript, using the Canvas element. I’ve been working on this project, off-and-on now, for the past 7 months – it’s been a fun, and quite rewarding, challenge.
blog/angular-express.html AngularJS is like the missing Batarang on your utility belt of web development awesomeness. It gives you two-way data binding that's both easy to use and fast, a powerful directive system that lets you use create reusable custom components, plus a lot more. Express is an excellent webserver for Node.js that provides routing, middleware, and sessions. Incidentally, the two work quite well together! In this tutorial, I'm going to walk through writing a simple blog app with Angular and Express. For this, I'm assuming basic knowledge of Angular and Node. Sonos & Spotify (Ksenia Lotnik) How We Connect We maintain connections in their hundreds, sometimes thousands, on social media and our networks of “friends” are linked by likes and shares. We can go for months without a face to face interaction with some of the people we consider closest to our hearts. Against this backdrop, the need for tactile friendship has risen and we’re witnessing a renaissance of friendship’s truest forms.
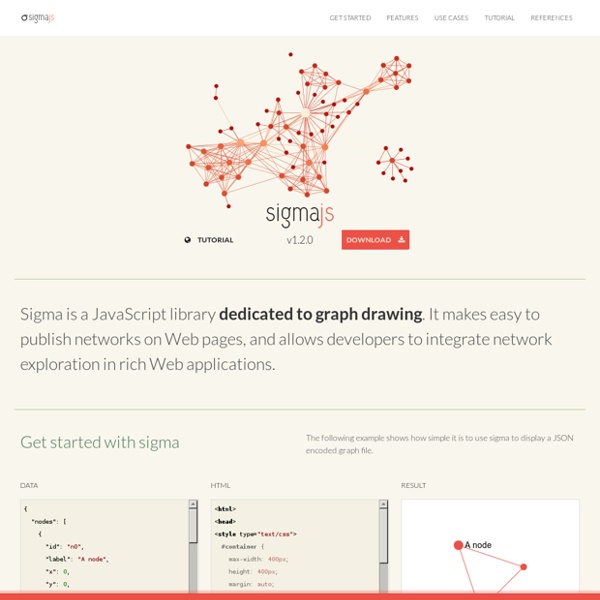
progressive <canvas> pie charts Peity (sounds like deity) is a jQuery plugin that converts an element's content into a <svg> mini pie 2/5 donut 5,2,3 line 5,3,9,6,5,9,7,3,5,2 or bar chart 5,3,9,6,5,9,7,3,5,2 and is compatible with any browser that supports <svg>: Chrome, Firefox, IE9+, Opera, Safari. Download version 3.2.1 Uncompressed 8.7Kb jquery.peity.js Graph Graph Description In mathematics and computer science, graph theory studies networks of connected nodes and their properties. A graph can be used to visualize related data, or to find the shortest path from one node to another node for example. Central concepts in graph theory are: Node: a block of information in the network.Edge: a connection between two nodes (can have a direction and a weight).Centrality: determining the relative importance of a node.Clustering: partitioning nodes into groups.
Operational transformation Operational transformation (OT) is a technology for supporting a range of collaboration functionalities in advanced collaborative software systems. OT was originally invented for consistency maintenance and concurrency control in collaborative editing of plain text documents. Two decades of research has extended its capabilities and expanded its applications to include group undo, locking, conflict resolution, operation notification and compression, group-awareness, HTML/XML and tree-structured document editing, collaborative office productivity tools, application-sharing, and collaborative computer-aided media design tools (see OTFAQ). In 2009 OT was adopted as a core technique behind the collaboration features in Apache Wave and Google Docs.
"One Angry Bird" : arcs émotionnels (Pierre) Methods All emotions were derived using the Microsoft Emotion API on standard video feeds. This service receives video as an input and outputs a timestamped identification of emotions detected in any faces present. JavaScript Charts With SVG – xCharts xCharts is an open JavaScript charting library that is built on top of D3. It works with using HTML-CSS + SVG to create good-looking and custom-data-driven charts with ease. There is support for 4 chart types: bar, cumulative, line and line-dotted where the colors, text,dimensions can all be defined via CSS.