

How to monitor deadlock using extended events in SQL Server 2008 and later - Microsoft SQL Server Tips & Tricks. SQL Server Backup, Integrity Check, Index and Statistics Maintenance. Error rebuilding indexes on all tables in a DB. Prevent SQL Server Reporting Services Slow Startup. Problem SQL Server Reporting Services 2008 (SSRS 2008) starts up slowly after a period of inactivity when I try to access the reports page.
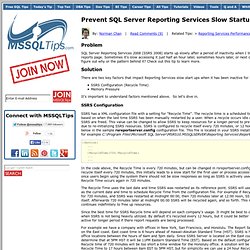
Sometimes it's slow accessing it just half an hour later, sometimes hours later, or next day, but I can't figure out why or the pattern behind it? Check out this tip to learn more. Solution. Solving issue with first long starting report on SSRS 2008 » Pavel's SQL Pages. As I wrote in my previous blog post First report and report after specific time interval starts a long time on MS SQL 2008 Reporting Services, a first report after specific time takes very long to start.
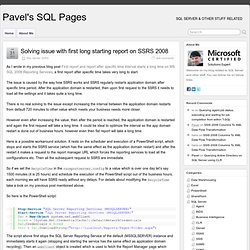
The issue is caused by the way how SSRS works and SSRS regularly restarts application domain after specific time period. After the application domain is restarted, then upon first request to the SSRS it needs to load all the settings and it takes quite a long time. There is no real solving to the issue except increasing the interval between the application domain restarts from default 720 minutes to other value which meets your business needs more closer. However even after increasing the value, then after the period is reached, the application domain is restarted and again the first request will take a long time. SQL Server Backup, Integrity Check, Index and Statistics Maintenance. Parameter Sniffing, Embedding, and the RECOMPILE Options. Parameter Sniffing Query parameterization promotes the reuse of cached execution plans, thereby avoiding unnecessary compilations, and reducing the number of ad-hoc queries in the plan cache.
These are all good things, provided the query being parameterized really ought to use the same cached execution plan for different parameter values. Using tables as Queues. A very common question asked on all programming forums is how to implement queues based on database tables.
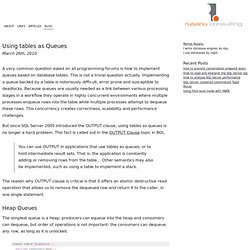
This is not a trivial question actually. Implementing a queue backed by a table is notoriously difficult, error prone and susceptible to deadlocks. Because queues are usually needed as a link between various processing stages in a workflow they operate in highly concurrent environments where multiple processes enqueue rows into the table while multiple processes attempt to dequeue these rows. This concurrency creates correctness, scalability and performance challenges. But since SQL Server 2005 introduced the OUTPUT clause, using tables as queues is no longer a hard problem. You can use OUTPUT in applications that use tables as queues, or to hold intermediate result sets. The reason why OUTPUT clause is critical is that it offers an atomic destructive read operation that allows us to remove the dequeued row and return it to the caller, in one single statement.
Generating Concurrent Activity. I’ve discovered that DBAs use different methods to accomplish what amounts to the same thing: Generating concurrent activity on a server.

I want to explore a number of methods I’ve seen. For each method, I want to call one particular procedure, many times at once, and often… Oh, and for free. Why are we doing this? For Testing: The whole point is to generate concurrent activity on the server. Testing with this kind of activity is one of the only ways to avoid resource contention issues.For Demos: Concurrency issues are so common and so varied, that it’s not surprising how often we see demos that depend on this kind of generated database activity.For Troubleshooting: This is my favorite reason. Detecting and Ending Deadlocks. A deadlock occurs when two or more tasks permanently block each other by each task having a lock on a resource which the other tasks are trying to lock.
The following graph presents a high level view of a deadlock state where: Task T1 has a lock on resource R1 (indicated by the arrow from R1 to T1) and has requested a lock on resource R2 (indicated by the arrow from T1 to R2).Task T2 has a lock on resource R2 (indicated by the arrow from R2 to T2) and has requested a lock on resource R1 (indicated by the arrow from T2 to R1).Because neither task can continue until a resource is available and neither resource can be released until a task continues, a deadlock state exists. The SQL Server Database Engine automatically detects deadlock cycles within SQL Server.
The Database Engine chooses one of the sessions as a deadlock victim and the current transaction is terminated with an error to break the deadlock. The Database Engine typically performs periodic deadlock detection only. Using isnull in where clause is expensive in SQL Server. My Easy New Year’s Resolutions (Guest Post) Hi!
I’m your SQL Server. I know you don’t usually listen to me, so I’ve decided to take a drastic step and find you where you spend all your time – Brent’s blog. Seriously, you need to spend less time on the intertubes and more time on the error logs. You’re lucky this post is about me, not about you, or else I’d also have to divulge the fact that you installed Adobe Flash on my desktop. Whoops, I just did. Resolution 1: Keep in Touch with Loved Ones Bad things have been happening to me all year long, but I’ve been keeping it secret from you.
How to monitor deadlock using extended events in SQL Server 2008 and later - Microsoft SQL Server Tips & Tricks. Analysis Services Query Performance Top 10 Best Practices. Improving Analysis Services Query Performance. Analysis Services is a high-performance, multidimensional query engine for processing analytical and statistical queries, which a relational SQL engine doesn't handle well.
When such queries are simple or have pre-aggregations, Analysis Services can make your job easier. But when queries become complex, Analysis Services can bog down. For example, an SQL SELECT statement that includes a GROUP BY clause and aggregate functions can take as long as a few minutes—or more. You can retrieve the same result set in just a few seconds if you execute an MDX statement against an Analysis Services Multidimensional OLAP (MOLAP) cube. SQL Server Perfmon Counters Tutorial. Database administrators need to know each SQL Server’s weakest link so we know where to focus their hardware budgets and time.
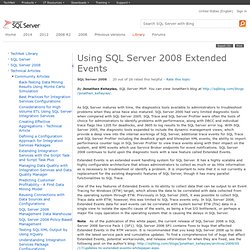
On any given server, we need to know what the slowest component is, and where it’ll pay off to invest hours and dollars. This is performance tuning, and the first place to start is by using Performance Monitor. Performance Monitor, or Perfmon, measures performance statistics on a regular interval, and saves those stats in a file. The database administrator picks the time interval, file format, and which statistics are monitored. After the stats are gathered over a period of time (hours or days), we can do analysis by opening the results in Excel and setting up some basic formulas. Perfmon isn’t just for SQL Server tuning: system administrators use it to monitor performance on Windows itself, Exchange, file & print servers, and anything else that can run into bottlenecks. Using SQL Server 2008 Extended Events. By Jonathan Kehayias, SQL Server MVP.
Create an Extended Events Session Using the Wizard (Object Explorer) To help you select and capture events on your server, Extended Events includes a New Session Wizard that guides you through the steps to create an Extended Events session. The New Session Wizard exposes most of the Extended Events functionality. The New Session dialog also lets you define an Extended Events session that captures, displays, and analyzes your data. The New Session dialog exposes all Extended Events functionality. To open the New Session Wizard In Object Explorer, expand the Management node, and then expand Extended Events. Use the following New Session Wizard pages to create an event session On the Introduction page, do the following: On the Introduction page of the New Session Wizard, click Next. On the Set Session Properties page, do the following: In the Session name box, type a meaningful name for the event session.
On the Choose Template page, do the following: On the Select Events to Capture page, do the following: On the Capture Global Fields page, do the following: Easy Ways to Detect I/O Pressure in SQL Server 2008. It is pretty common for large, busy SQL Server instances to run into I/O bottlenecks. Even smaller, less busy systems often run into problems when they are not sized and configured correctly.
As a database professional, you need to be able to detect when your SQL Server instances are experiencing poor performance due to I/O bottlenecks. Quite often, you may need to convince someone from another part of the organization (such as a SAN engineer or server administrator) that your SQL Server instances are seeing decreased performance because of I/O issues. It is also very possible that you have plenty of capacity, and that your I/O subsystem is configured correctly, but that you have some poorly written queries that are causing excessive disk I/O.
Before you start talking to the rest of the organization, it is a good idea to know what the real issue is.