
Untitled. Untitled. A veces recurrir a otra perspectiva nos ayuda a entender mejor el mundo que creemos conocer también, pudiéndonos llevar alguna sorpresa como ocurre al ajustar el mapamundi al tamaño real y no a la proyección Mercator.

Y lo que nos permite visualizar el periodista e ingeniero Matt Daniels es lo "altas" que son las ciudades según su población y no tanto su tamaño. Hay urbes que sabemos que van a tener una montaña considerable, como Nueva York o Hong Kong, pero lo que nos muestra también son los contrastes demográficos entre un país y otro y dentro de una misma región. Dividiendo en kilómetros cuadrados y jugando con los colores, así queda el mundo en 3D según lo habitamos, que no somos pocos. Demasiadas personas y muy mal repartidas Para bien o para mar, el ser humano es una especie cada vez más abundante en el planeta Tierra.
A la izquierda Nueva York en 2D, a la derecha en 3D (y la leyenda de color al medio). Untitled. Untitled. HUMAN DEVELOPMENT REPORTS.
Population, Sustainability, and Malthus: Crash Course World History 215. Si España fuese un pueblo de 100 habitantes. MUNDO ACTUAL A TRAVÉS DE MAPAS. Already a member?

Go to login. Embed in Blog. World Population Prospects - Population Division - United Nations. The 2019 Revision of World Population Prospects is the twenty-sixth round of official United Nations population estimates and projections that have been prepared by the Population Division of the Department of Economic and Social Affairs of the United Nations Secretariat. The main results are presented in a series of Excel files displaying key demographic indicators for each UN development group, World Bank income group, geographic region, Sustainable Development Goals (SDGs) region, subregion and country or area for selected periods or dates within 1950-2100.
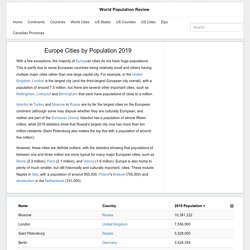
For advanced users who need to use these data in a database form or statistical software, we recommend to use the CSV format for bulk download. Special Aggregates also provide additional groupings of countries. Quick Navigation Disclaimer: This web site contains data tables, figures, maps, analyses and technical notes from the current revision of the World Population Prospects. Población: España 2018. Europe Cities by Population 2019. With a few exceptions, the majority of European cities do not have huge populations.

This is partly due to some European countries being relatively small and others having multiple major cities rather than one large capital city. For example, in the United Kingdom, London is the largest city (and the third-largest European city overall), with a population of around 7.5 million, but there are several other important cities, such as Nottingham, Liverpool and Birmingham that each have populations of close to a million.
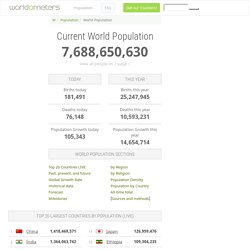
Istanbul in Turkey and Moscow in Russia are by far the largest cities on the European continent (although some may dispute whether they are culturally European, and neither are part of the European Union). Untitled. Population Clock: World. World Population Clock: 7.6 Billion People. World Population: Past, Present, and Future (move and expand the bar at the bottom of the chart to navigate through time) The chart above illustrates how world population has changed throughout history.

View the full tabulated data. At the dawn of agriculture, about 8000 B.C., the population of the world was approximately 5 million. Over the 8,000-year period up to 1 A.D. it grew to 200 million (some estimate 300 million or even 600, suggesting how imprecise population estimates of early historical periods can be), with a growth rate of under 0.05% per year. A tremendous change occurred with the industrial revolution: whereas it had taken all of human history until around 1800 for world population to reach one billion, the second billion was achieved in only 130 years (1930), the third billion in 30 years (1960), the fourth billion in 15 years (1974), and the fifth billion in only 13 years (1987).
ESPAÑA. World Population. WatchKnowLearn ratings are intentionally harsher than what you might find on YouTube, for example.

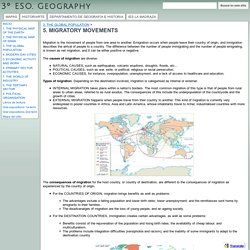
Most of our videos have been imported by people who want to use them with kids, not by the creators of the videos. We take a hard-nosed attitude toward quality. Four and five stars should be reserved for really excellent quality. Three stars isn't bad. Two is often watchable and shouldn't be ruled out. 5 stars = Exemplary. More help with rating Unless changed, the Finder is the person who uploaded the video to WatchKnowLearn. More help about the Finder field. Overpopulation – The Human Explosion Explained. Hans Rosling: Global population growth, box by box. 5. MIGRATORY MOVEMENTS - 3º ESO. Geography. 1.

What is migration? 2. Here are four reasons why people migrate. Fill in the blanks to say what sort of type of factor caused them to move: economic, change, homesick, political, environmental or social: Moving to be closer to friends and family is a/an _______________ factor. 3. 4. Population 3º ESO Flashcards. Population pyramids. Population Education. How to Read a Population Pyramid. Population pyramids: Powerful predictors of the future - Kim Preshoff. Understanding Population Pyramids. GCSE Bitesize: Analysing population pyramids. Types of Population Pyramids. Population Pyramids of the World from 1950 to 2100 - PopulationPyramid.net. El Poblamiento - Unidad 10 - 3º ESO.