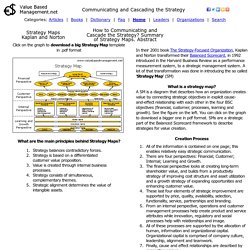

My Library. Nikebiz : NIKE, Inc. Official Site, the world’s largest, leading athletic brand. Strategy Maps - Kaplan Norton. In their 2001 book The Strategy-Focused Organization, Kaplan and Norton transformed their Balanced Scorecard, in 1992 introduced in the Harvard Business Review as a performance measurement system, to a strategic management system.

A lot of that transformation was done in introducing the so called 'Strategy Map' (SM) What is a strategy map? A SM is a diagram that describes how an organization creates value by connecting strategic objectives in explicit cause-and-effect relationship with each other in the four BSC objectives (financial, customer, processes, learning and growth). See the figure on the left. You can click on the graph to download a bigger one in pdf format. Creation Process All of the information is contained on one page; this enables relatively easy strategic communication. Why strategy maps? More strategic management and corporate finance models. EDGAR Search Results - NIKE FIlings. R&D 100. R&D intensity is the ratio of R&D expenditures to sales.

Five years of R&D spending data reveal some radical fluctuations in intensity for certain industries in our list, including a nasty drop for telecommunications services and materials. The intensity increase in the pharmaceuticals and biotechnology sector far outpaces those of other sectors. "Intensity Change" is calculated by comparing an industry's R&D intensity in 2000 to its intensity in 2004. Technology Hardware and Equipment 2004 R&D Expenditures US $64.8 billion R&D growth 2000-2004 -9% Sales growth2000-2004 3% Intensity change 2000-2004 -9% Automobiles and Components $61.9 billion R&D growth 2000-2004 52% Sales growth 2000-2004 48% Intensity change 2000-2004 2% Pharmaceuticals and biotechnology 2004 r&D Expenditures $51.7 billion R&D growth 2000-2004 24% Sales growth2000-2004 11% Intensity change 2000-2004 12% Capital Goods $25.9 billion R&D growth 2000-2004 41% Sales growth 2000-2004 32% Intensity change 2000-2004 6% $19.8 billion $8.9 billion.
Next-Generation EDGAR system - Better Data. Stronger Markets. Skip to Main Content Company Filings | More Search Options EDGAR | Search Tools Free access to more than 20 million filings Since 1934, the SEC has required disclosure in forms and documents.

In 1984, EDGAR began collecting electronic documents to help investors get information. EDGAR Search Tools You can search information collected by the SEC several ways: Custom searches Resources Researching Public Companies Through EDGAR: A Guide for Investors In this guide, you’ll find tips for using EDGAR and answers to frequently asked questions about researching public companies. 12.RDchart.pdf (application/pdf Object) The R&D 100. Consider these three industries: pharmaceuticals, semiconductors, and software.

They all have very high R&D intensities, but each invests in R&D in its own way, shaped by its own risks, time to market, industrial organization, regulatory regimes, and business models. Pharmaceuticals companies live and die on R&D: their R&D Intensity averages 16.4 percent. Because the vast majority of apparently promising compounds end up as failures, a firm must sink billions of dollars over many years just to get one or two successes. That's why a drug company's fortunes can turn on the result of a single patent trial; it's also why pharmaceutical analysts work ferociously to track R&D projects as they snake their way through the many stages of the pipeline.
Herman Saftlas, who covers some major pharmaceutical companies for Standard & Poor's, says most firms highlight their pipelines much as a manufacturer might account for back orders. So, keep the following in mind as you review our R&D leaderboard. R&D 100. R&D 100.