

ANOVA in agronomy: How to ensure its reliability ? “Elaborate statistics are not substitute for meticulous experimentation.”6 G.W.

Snedecor From our 30 years of experience in IT for plant breeding and testing departments, at Doriane we have seen the benefits to let a secured analysis tool in the hands of researchers. Statistics are the cornerstone of vegetal experimentation, and R&D departments have much to gain in facilitating and automating the whole procedure. Is this article not enough for your statistical hunger? Check out our webinar “Vegetal R&D stastistics with a smile !”
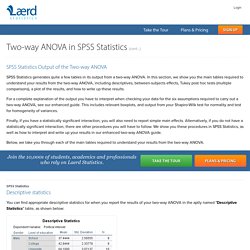
Two-way ANOVA Output and Interpretation in SPSS Statistics - Including Simple Main Effects. SPSS Statistics Descriptive statistics You can find appropriate descriptive statistics for when you report the results of your two-way ANOVA in the aptly named "Descriptive Statistics" table, as shown below: Published with written permission from SPSS Statistics, IBM Corporation.
Analysis of Covariance (ANCOVA): An Overview - Magoosh Statistics Blog. One of my favorite things to say to my students is “Adults look for solutions, not excuses.”

Well, in statistics, we often use the error of a particular method as an excuse for why our model is different from the data. But there is a way to explain the error (a solution, if you will). 12 One Way Within Groups ANOVA. How do I report paired samples T-test data in APA style? Three things to report You will want to include three main things about the Paired Samples T-Test when communicating results to others. 1.
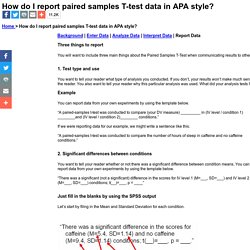
Test type and use You want to tell your reader what type of analysis you conducted. If you don’t, your results won’t make much sense to the reader. Interpret SPSS output for an independent t-test. One Sample t Test. The t distribution provides a good way to perform one sample tests on the mean when the population variance is not known provided the population is normal or the sample is sufficiently large so that the Central Limit Theorem applies (see Theorem 1 and Corollary 1 of Basic Concepts of t Distribution).
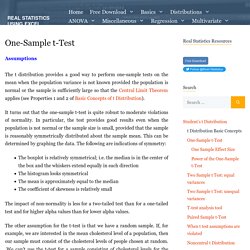
It turns out that the t distribution provides good results even when the population is not normal and even when the sample is small, provided the sample data is reasonably symmetrically distributed about the sample mean. This can be determined by graphing the data. (1) Week 13 - Mixed ANOVA. Slides anova assumptions. The Test Statistic. Explanations > Social Research > Analysis > The Test Statistic Variance | The test statistic ratio | Interpreting the statistic | See also Variance When you do any test, there will be variation in results.
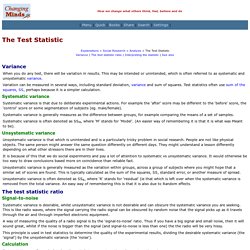
This may be intended or unintended, which is often referred to as systematic and unsystematic variance. Variation can be measured in several ways, including standard deviation, variance and sum of squares. Systematic variance Systematic variance is that due to deliberate experimental actions. Hand Calculation of ANOVA. Repeated Measures ANOVA - Understanding a Repeated Measures ANOVA. Introduction Repeated measures ANOVA is the equivalent of the one-way ANOVA, but for related, not independent groups, and is the extension of the dependent t-test.
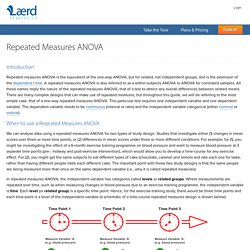
A repeated measures ANOVA is also referred to as a within-subjects ANOVA or ANOVA for correlated samples. All these names imply the nature of the repeated measures ANOVA, that of a test to detect any overall differences between related means. There are many complex designs that can make use of repeated measures, but throughout this guide, we will be referring to the most simple case, that of a one-way repeated measures ANOVA. This particular test requires one independent variable and one dependent variable. Chap8. T-test online. Compare two means, two proportions or counts online. Simple Interactive Statistical Analysis Input.
Compare two independent samples Counted numbers. To test for the significance of a difference between two Poisson counts. Input two observed counts in the top two boxes. Select options and hit the calculate button. Compare a single sample with the population Counted numbers. Select the one sample option, other options and hit the calculate button. TOP / table input / data input. General Linear Model. « PreviousHomeNext » The General Linear Model (GLM) underlies most of the statistical analyses that are used in applied and social research.
It is the foundation for the t-test, Analysis of Variance (ANOVA), Analysis of Covariance (ANCOVA), regression analysis, and many of the multivariate methods including factor analysis, cluster analysis, multidimensional scaling, discriminant function analysis, canonical correlation, and others. Because of its generality, the model is important for students of social research. Although a deep understanding of the GLM requires some advanced statistics training, I will attempt here to introduce the concept and provide a non-statistical description.
The Two-Variable Linear Model The easiest point of entry into understanding the GLM is with the two-variable case. The goal in our data analysis is to summarize or describe accurately what is happening in the data. Questions and answers about language testing statistics: Effect size and eta squared. Shiken: JALT Testing & Evaluation SIG Newsletter Vol. 12 No. 2.
Apr. 2008. (p. 38 - 43) [ISSN 1881-5537] PDF Version. Eta squared hcr. Onewayrmspss. RepeatedMeasuresANOVA. Learn Math and Stats with Dr. G. ANOVA Testing Example Excel Example for this ANOVA See a HOW TO Video of this Example A research study compared the ounces of coffee consumed daily between three groups. Group1 was Italians, Group 2 French, and Group 3 American. Determine if there is a significant difference among the groups using a 5% level (alpha is .05). Group1: Italian Group 2: French Group 3: American. Two-way anova - Handbook of Biological Statistics. This is a draft of the Third Edition of this handbook. It may change at any time.
Until this is finished, you may want to use the Second Edition. Summary. Degrees of Freedom Tutorial. A lot of researchers seem to be struggling with their understanding of the statistical concept of degrees of freedom. Most do not really care about why degrees of freedom are important to statistical tests, but just want to know how to calculate and report them.
This page will help. For those interested in learning more about degrees of freedom, take a look at the following resources: I couldn’t find any resource on the web that explains calculating degrees of freedom in a simple and clear manner and believe this page will fill that void. It reflects my current understanding of degrees of freedom, based on what I read in textbooks and scattered sources on the web. ANOVA. Determine sample size two-way ANOVA? Computing required sample size for experiments to be analyzed by ANOVA is pretty complicated, with lots of possiblilities. To learn more, consult books by Cohen or Bausell and Li, but plan to spend at least several hours. Two-way ANOVA, as you'd expect, is more complicated than one-way. The complexity comes from the many possible ways to phrase your question about sample size. The rest of this article strips away most of these choices, and helps you determine sample size in one common situation, where you can make the following assumptions: There are two levels of the first factor, say the factor is Drug and you either gave the drug or gave vehicle (placebo).
If those limitations aren't a problem for you, then read on for a simple way to compute necessary sample size. Sample size is always determined to detect some hypothetical difference. Complex ANOVA 2 factor flashcards. Analysis of Variance (ANOVA) - StatsDirect. Problem of alpha inflation. The main problem that designers of post hoc tests try to deal with is -inflation. This refers to the fact that the more tests you conduct at = .05, the more likely you are to claim you have a significant result when you shouldn't have (i.e., a Type I error).
Doing all possible pairwise comparisons on the above five means (i.e., 10 comparisons) would increase the overall chance of a Type I error to i.e., a 40.1% chance of making a Type I error somewhere among your six t-tests (instead of 5%)!! ANOVA - Main. Microsoft Word - sstypes.doc - sstypes.pdf. Between-Groups, Within Groups. Research Methods and Statistics: A Critical Thinking Approach - Sherri L. Jackson. Introduction to ANOVA. Assumptions of Statistical Tests. “All models are incorrect. Some are useful.” George Box When you do a statistical test, you are, in essence, testing if the assumptions are valid. We are typically only interested in one, the null hypothesis. Multiple Hypothesis Testing.
T-Tests. One Way ANOVA. Post Hoc. Two Way & Rpt Measures ANOVA. How To Identify Patterns in Time Series Data: Time Series Analysis. In the following topics, we will first review techniques used to identify patterns in time series data (such as smoothing and curve fitting techniques and autocorrelations), then we will introduce a general class of models that can be used to represent time series data and generate predictions (autoregressive and moving average models).
Finally, we will review some simple but commonly used modeling and forecasting techniques based on linear regression.