
Scientists Find Peak 1940s Warmth, Post-1950s Cooling In The Same Western US Region Where Hockey Sticks Emerged. By Kenneth Richard on 24.

September 2020 A new 1735-2015 temperature reconstruction (Heeter et al., 2020) using Western US tree ring proxies shows peak 1940s warmth and post-1950s cooling. This is the same region Dr. (2) IPCC pressure tactics exposed: A Climategate Backgrounder. DailyKos: It’s OK for Climate Alarmists to Make Things Up Out of Thin Air - Climate Realism. The leftist website Daily Kos published an article yesterday claiming climate alarmists are more scientifically credible when they make things up out of thin air – while presenting no supporting scientific facts or evidence – than when climate realists cite numerous datasets and peer-reviewed studies that support their claims.

Making stuff up out of thin air is acceptable, honorable, and compelling, according to DailyKos, if you do it in the name of climate alarmism. Earlier this week, we published an article here at Climate Realism calling attention to dubious claims made by prominent climate alarmist Katharine Hayhoe in her public presentations to Christian groups. We specifically noted that Hayhoe uses an apparently self-made chart in her presentations that shows global temperatures steadily and monotonously declining, with almost no variations, for nearly 6,000 years. PODCAST: Dr. Ross McKitrick on climate, hockey-sticks, and Mann. Dr.

Ross McKitrick of the University of Guelph, Canada, is a professor of economics who got interested in the climate debate after looking over satellite data. He found the climate community very unresponsive and went on his own journey to discover what was up. He, alongside Steve McIntyre, challenged the famous Hockey Stick paper. McIntyre speaks: on Mann, sticks, and data mannipulation. I interviewed Steve McIntyre, founder of the blog Climate Audit, about his journey into climate science and debunking the infamous ‘hockey stick.’

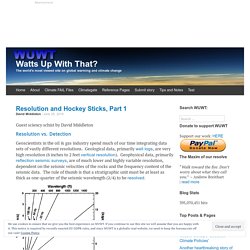
This is the most in-depth interview with Steve McIntyre ever to be published, and there’s a bonus secret revealed at the end. Steve McIntyre, founder and editor of the blog dedicated to analysis of climate data Climate Audit, discusses how he first became interested in climate discussion. He and friend Dr. Resolution and Hockey Sticks, Part 1. Guest sciency schist by David Middleton Resolution vs.

Return of the Hockey Stick. The story of the Modern Warming Spike (AKA the Hockey Stick) and its Rise and Fall is recounted in a previous post, reprinted later on.

The news today is about a fresh initiative to reassert the discredited analysis using a new temperature reconstruction combining proxies stored by the PAGES2K network. In a recent post Marcel Crok described his initiation into the climate wars as a young science journalist and discovering that two Canadians (Ross McKitrick and Steve McIntyre) had proved false Michael Mann’s modern warming spike. As he says correctly: The arguments of the critics were not difficult to refute and the work of the two Canadians stands firmly to this day. 20 Years Later, The ‘Hockey Stick’ Graph Behind Waves Of Climate Alarmism Is Still In Dispute. It was 20 years ago, climate scientist Michael Mann published his famous “hockey stick” graph that he says “galvanized climate action” by showing unprecedented global warming.
Original “hockey stick” temperature graph in Nature, 1998.
Hockey Stick: Yamal-Briffa. Hockey Stick: Marcott. Hockey Stick: Gergis (2012, 2016) McShane and Wyner. Caspar and Wahl (2005) Hockey Sticks: PAGES Tree Rings. Hockey Stick: Kauffman 2020. Non-Hockey Stick Reconstructions. Climategate(s) and other Scandals. ‘Mikes Nature Trick’ Revisited- @ScottAdamsSays edition. Those of use that have Twitter accounts know that in the past couple of weeks, Dilbert creator and cartoonist Scott Adams has been delving into the question of who has the more credible arguments: Climate Alarmists or Climate Skeptics?

One of the issues being discussed was “Mikes Nature Trick” and Steve McIntyre of ClimateAudit tried to help Scott Adams understand what actually happened. Unfortunately, like many issues in the climate world, unless you have some “inside baseball” knowledge, such things often cause eyes to glaze over as is the case with Scott Adams. Mann's hockey stick disappears – and CRU's Briffa helps make the MWP live again by pointing out bias in the data. Shock, awe.

Untruncated and unspliced data used in a new paper from Briffa and Melvin at UEA restores the Medieval Warm Period while at the same time disappears Mann’s hockey stick. Here’s figure 5 that tells the story: Figure 5. Temperature reconstructions created using the 650-tree (‘alltrw’ data) TRW chronology (a) and the 130 tree (‘S88G1112’ data) MXD chronology (b). Chronologies were created using two RCS curves and were regressed against the Bottenviken mean May–August monthly temperature over the period 1860 to 2006. Look at graph 5c, and you’ll see 20th century warmth matches peaks either side of the year 1000, and that for the TRW chronology 20th century warmth is less than the spike around 1750. Hockey Stick Was Refuted Before Its Fabrication – Study Ignored – IPCC And Mann Took World On 10-Year Joyride. Geologist Dr.

Sebastian Lüning and Prof. Once again, climate scientists use a single tree to define global change. From Keele University and the “It’s like deja vu all over again” department with the leader of the “ship of fools” thrown in for comic relief.

Long-time WUWT readers surely remember the single “Most influential tree in the world” from the Yamal fiasco, where the “signal” in one tree (YAD06) biased an entire paper with a hockey stick shape, making it worthless. Well, here we are again with another single tree used to define the entire globe. Obviously they’ve learned nothing, then again, it’s Chris Turney. Climatology Sees One Of The Greatest Scientific Reversals Of All Time – The Rise And Fall Of The Hockey Stick Charts. Rise and Fall of the Modern Warming Spike. The first graph appeared in the IPCC 1990 First Assessment Report (FAR) credited to H.H.Lamb, first director of CRU-UEA.
The second graph was featured in 2001 IPCC Third Assessment Report (TAR) the famous hockey stick credited to M. Mann. A previous post Rise and Fall of CAGW described the process that began with Hansen’s flashy Senate testimony in 1988, later supported by Santer’s flashy paper in 1996. Make your own Michael Mann hockey stick at home. Following yesterday’s first look at emails from the 2 year effort to get NOAA to release emails from FOIA requests, where we learn that some scientists felt ‘Hit on the head with a hockey stick’ and that “The paleodata always got a lot more attention from the general public than it deserved.”. There’s a great article today at SPPI today Michael Mann — the ghost of climate past which summarizes the whole hockey stick affair quite well. It draws heavily on a post from May of this year on PJ Media by Rand Simberg titled The Death of the Hockey Stick? In that post I found this little nugget below from December 2009, one that I apparently missed in the furor immediately following Climategate1.
I’m now correcting that oversight. What is it? From his May 2012 essay: Yep, Iowahawk. Climate Audit. PAGES2K (2017): Antarctic Proxies. Mann’s new sea level hockey stick paper. WUWT readers may recall yesterday where Dr. Mann was so eager to list this paper on his resume/CV, he broke the embargo set for 15:00 EST June 20th, today, at which time this blog post appears. As much as this is an editorial target rich environment, I’m going to publish this press release and paper sans any editorial comment. There’s plenty of time for that later. Let’s all just take it in first.
Below, figure 2 from the Kemp et al 2011 paper. Embargoed for release: 20-Jun-2011 15:00 ET (20-Jun-2011 19:00 GMT) Contact: Evan Lernerelerner@upenn.edu 215-573-6604University of PennsylvaniaPenn researchers link fastest sea-level rise in 2 millennia to increasing temperatures PHILADELPHIA — An international research team including University of Pennsylvania scientists has shown that the rate of sea-level rise along the U.S. The 100% Fraudulent Hockey Stick. In 1999, NASA showed no net global warming from 1876 to 1976.
This wrecked their hockey stick plans, so NASA erased all of the inconvenient pre-1880 data and cooled 1880 temperatures by about 0.2C. This abuse of science is atrocious, but it gets worse. The NASA data had already been highly corrupted in 1999. New Cherry Pie – Climate Audit. Rosanne D’Arrigo once explained to an astounded National Academy of Sciences panel that you had to pick cherries if you wanted to make cherry pie – a practice followed by D’Arrigo and Jacoby who, for their reconstructions, selected tree ring chronologies which went the “right” way and discarded those that went the wrong way – a technique which will result in hockey sticks even from random red noise. Her statement caused a flurry of excitement among Climategate correspondents, but unfortunately the NAS panel didn’t address or explain the defects in this technique to the lignumphilous paleoclimate community.
My long-standing recommendation to the paleoclimate community has been to define a class of proxy using ex ante criteria e.g. treeline black spruce chronologies, Antarctic ice cores etc., but once the ex ante criterion is selected, use a “simple” method on all members of the class.