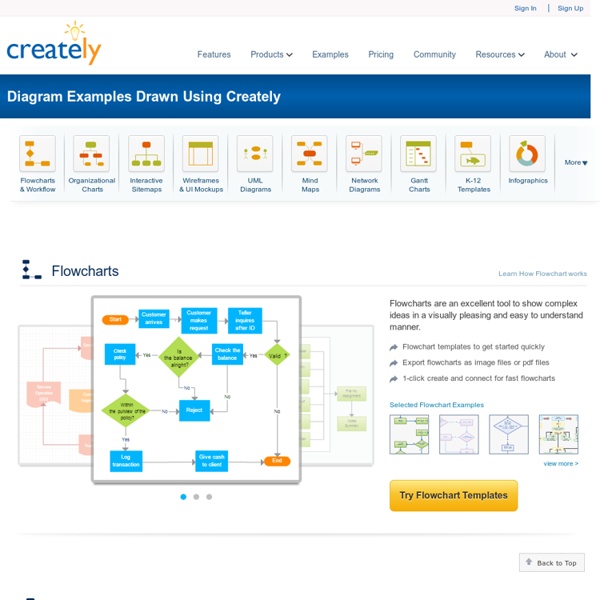


http://creately.com/diagram-examples
UML Tutorial - UML Unified Modelling Language - Sparx Systems The Unified Modeling Language (UML) has quickly become the de-facto standard for building Object-Oriented software. This tutorial provides a technical overview of the 13 UML diagrams supported by Enterprise Architect. UML 2 semantics are explained in detail in the new UML 2.0 tutorial. Firstly... What is UML? The OMG specification states: Examples of Gliffy Diagrams Gliffy’s friendly editor, vast symbol libraries, and handy templates make it easy to communicate your thoughts and plans visually. You’re just minutes away from all the diagrams you need: Flow Charts FusionCharts Free - Open Source Charting Component for Web & Mobile Apps World is moving away from Flash and so are we. FusionCharts Free was our free flash based charting library, and it is no more under active development. If you are an existing user, you can refer the documentation here.
BeFunky: Create Infographics With Ease Whether you remove the object with our {{cutout_tool}} or use the {{clone_tool}} to cover it up, BeFunky Plus has the tools you need to remove anything from any photo. Take unique to the next level. BeFunky Plus has a collection of {{artsy_effects}} that’ll transform your photos into cartoons, paintings, sketches, and more! With {{batch_processing}} you can crop, resize, and edit hundreds of photos all at the same time. Sparx Systems Enterprise Architect Community Site CrossOver is one of the easiest and afforable ways to get Enterprise Architect 9.0 up and running on Mac or Linux! Watch the short instructional video, then be sure to visit the community page for Enterprise Architect 9.0 for Mac and Linux to download a free trial of CrossOver and to receive a discounted rate for purchasing CrossOver. Enterprise Architect 9.0 on Mac with CrossOver Enterprise Architect 9.0 on Linux with CrossOver
10 Useful Flash Components for Graphing Data By Jacob Gube Flash is an excellent technology for dealing with data visualization. It being client-side, it can reduce the amount of work your server has to perform in order to generate graphs and charts. Because of its robust ability in dealing with sleek and fluid animation and complex user interactivity, Flash is an excellent web and (and even desktop) application technology for dealing with graphing data. In this article, you will find ten excellent Flash components that will help you in building stunningly attractive, complex, and interactive data visuals. These components will help you create an assortment of graphs and charts to aid in presenting otherwise boring and stale numerical data.
ChartGo Stock Charts Simple and Professional Charts for online stock market trading With ChartGo, you can create professional looking finance charts as well as stock charts. Use as a charting tool to track real time commodity stock trading. For Online Stock and commodity trading. Increase stock value with gold and silver stocks. Mining and energy is driving markets ahead. UML Design Tools and UML CASE tools for software development Enterprise Architect enables you to build, test, debug, run and execute deployment scripts, all from within the Enterprise Architect development environment. With the ability to generate NUnit and JUnit test classes from source classes using MDA Transformations and integrate the test process directly into the Enterprise Architect IDE, you can now integrate UML and modeling into the build/test/execute/deploy process. Walk through executing code In addition to build/test and execute functionality, Enterprise Architect includes debugging capabilities for Java, .NET and Microsoft Native (C++, C and VB).
Creator Processing ... Personal $ Svg $20 ✓ Up to $75 merchandises for personal use. Merchandise $