

AI Index 2019. The AI Index is a starting point for informed conversations about the state of artificial intelligence (AI).

The report aggregates a diverse set of metrics, and makes the underlying data easily accessible to the general public. The 2019 edition tracks three times as many data sets as the 2018 edition. To help navigate the data, we've produced two tools. The Global AI Vibrancy Tool compares 28 countries’ global activities across 34 indicators, including both a cross-country perspective, as well as a country-specific drill down. The AI Index arXiv Monitor helps people conduct their own research into current technological progress in AI. The AI Index has worked hard to avoid measurement and evaluation bias. The AI Index Report is comprised of nine chapters:
How to identify a body: the Marchioness disaster and my life in forensic pathology. I took a call early one Sunday morning in August 1989 to warn me that there had been a disaster.

It was during the summer holidays and I was the forensic pathologist in charge of London and the south-east of England. Evaluating Infographics - 7th Grade Computers & Technology. No difference in knowledge obtained from infographic or plain language summary of a Cochrane systematic review: three randomized controlled trials - Journal of Clinical Epidemiology. 32 Innovations That Will Change Your Tomorrow. Smart, dumb, candybar, flip, and brick: a visual history of mobile phones. For most of their history, mobile phones have been shrinking.
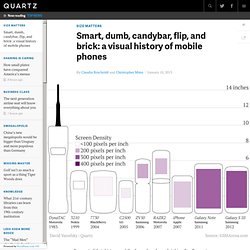
Small meant portable; it even, in the not too distant past, was a sort of status symbol. Remember Motorola’s runaway hit, the ultra-thin Razr? But something funny happened on the smartphone’s way to success. Even as the phones themselves became thinner and lighter, their screens started to grow. Design Thinking. Voronoi diagrams in 3ds Max.
Worldmapper: The world as you've never seen it before. 10000+ online newspapers in the world, translate with one click. Science On a Sphere. Playlist Builder ..
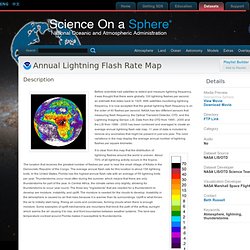
/ftp_mirror/atmosphere/lightning/media/thumbnail_small.jpg Annual Lightning Flash Rate Map dataset.php? Id=6 Annual Lightning Flash Rate Map Description Before scientists had satellites to detect and measure lightning frequency, it was thought that there were globally 100 lightning flashes per second, an estimate that dates back to 1925. What does the Internet look like? A multilayer graph model of the internet topology. What does the Internet look like and how can data be navigated it around it most efficiently and effectively?
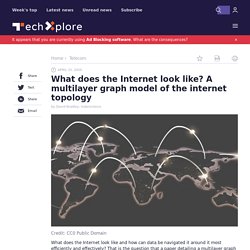
That is the question that a paper detailing a multilayer graph model of the internet topology could answer. Details are reported in the International Journal of Networking and Virtual Organisations. Georg Tilch and Benjamin Fabian of the Humboldt University of Berlin, and Tatiana Ermakova of the Central Research Institute of Ambulatory Health Care, in Germany discuss how internet maps can be used to develop effective routing algorithms.
The same maps can also be used to improve security mechanisms and resilience management at the internet service provider and commercial user level through detailed structural decomposition. The Art of Complex Problem Solving. History of Our World in Data. World Life Expectancy. Photomicrography Competition. Got It Down Cold: Cryo-Electron Microscopy Named Method of the Year. Posted on January 14th, 2016 by Dr.

Francis Collins Caption: Composite image of beta-galactosidase showing how cryo-EM’s resolution has improved dramatically in recent years. Older images to the left, more recent to the right. Credit: Veronica Falconieri, Subramaniam Lab, National Cancer Institute. How to Find the Most Recent Satellite Imagery Anywhere on Earth. At Azavea, we help our clients use machine learning and satellite imagery to map places all over the world—we’ve trained AI to map everything from buildings, to bodies of water, to solar panels and crosswalks.
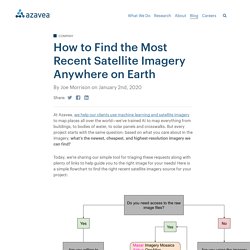
But every project starts with the same question: based on what you care about in the imagery, what’s the newest, cheapest, and highest-resolution imagery we can find? Today, we’re sharing our simple tool for triaging these requests along with plenty of links to help guide you to the right image for your needs! Here is a simple flowchart to find the right recent satellite imagery source for your project: Free, browsable data If you are just curious about seeing the most recent high-resolution image you can find for a given area of interest, and you don’t care about getting access to the raw images or using what you see for some commercial purpose, far-and-away the best tool you can use is Google Earth’s Explore New Satellite Imagery Tool.
Data & Society — The Promises, Challenges, and Futures of Media Literacy. Contemporary media literacy programs–commonly organized around the five main themes of youth participation, teacher training and curricular resources, parental support, policy initiatives, and evidence base construction–have demonstrated positive outcomes, particularly in the case of rapid responses to breaking news events, connecting critical thinking with behavior change, and evaluating partisan content.

Guide To Using Reverse Image Search For Investigations. Reverse image search is one of the most well-known and easiest digital investigative techniques, with two-click functionality of choosing “Search Google for image” in many web browsers.
This method has also seen widespread use in popular culture, perhaps most notably in the MTV show Catfish, which exposes people in online relationships who use stolen photographs on their social media. However, if you only use Google for reverse image searching, you will be disappointed more often than not. Limiting your search process to uploading a photograph in its original form to just images.google.com may give you useful results for the most obviously stolen or popular images, but for most any sophisticated research project, you need additional sites at your disposal — along with a lot of creativity. This guide will walk through detailed strategies to use reverse image search in digital investigations, with an eye towards identifying people and locations, along with determining an image’s progeny.
A Brief Comparison of Reverse Image Searching Platforms – DomainTools Blog. Overview This will be another of a hopefully long series of practical OSINT blog posts from the Security Research team here at DomainTools.
This time around I’ll be briefly comparing the reverse image search capabilities of some major image search engines. We’ll look at Google, Yandex, Bing, and TinEye. Hopefully you’re familiar with these search engines already but if you aren’t this post is a good crash course for what kind of results you can expect from each. First we’ll have Emily give an overview of reverse image searching, and then I’ll break down some comparisons between the most popular image search engines. Reverse Image Searching. How to recognize fake AI-generated images - Kyle McDonald - Medium. In 2014 machine learning researcher Ian Goodfellow introduced the idea of generative adversarial networks or GANs. “Generative” because they output things like images rather than predictions about input (like “hotdog or not”); “adversarial networks” because they use two neural networks competing with each other in a “cat-and-mouse game”, like a cashier and a counterfeiter: one trying to fool the other into thinking it can generate real examples, the other trying to distinguish real from fake.
The first GAN images were easy for humans to identify. How an ex-YouTube insider investigated its secret algorithm. YouTube’s recommendation system draws on techniques in machine learning to decide which videos are auto-played or appear “up next”. Sociable Media Group - MIT Media Lab. Social Science Research Council (SSRC) Research on Social Network Sites. Principles of Public Speaking - Public Words. Check files for metadata info. Breakthrough Collaborative Thinking - The world's first 3D Collaborative Mindmap. Disclosure Statement.
How to Use 43 Folders. A very simple guide to leaving here quickly so you can get back to making something awesome. Ask yourself… Is It Down Right Now? Website Down or Not? Is it Down - Check website status from this USA based server, you can confirm if a website is down or have any error. Is it down? Check at Down for Everyone or Just Me. Wayback Machine. Knowledge Translation. The future of data-driven decision-making. Executive summary Today, successful digital enterprises in every industry require a digital strategy that recognises the value of data, and digital institutions now need to embrace big data too.
Doing so will enable the institution to take advantage of emerging techniques and approaches such as Gartner's Insight Engines to generate actionable insights, improving equality and efficiency. Riffing. Rousting. Roundabout. Ruminating. Etudes. Entutelage.
Myth Story Tale. Rigmarole. Quotability. Remind Us. How To... SOME FUN NOW. Just Fun. Transmedia Expands Metaphors. WorldWide. ENGAGING SITES. Data visualization, infografica, mindmapping. Working with Data. Digital Creation Tools.