
Human Data Interactions. Architecture overview — Scrapy 0.24.6 documentation. This document describes the architecture of Scrapy and how its components interact.

Scrapy Engine¶ The engine is responsible for controlling the data flow between all components of the system, and triggering events when certain actions occur. See the Data Flow section above for more details. Scheduler¶ The Scheduler receives requests from the engine and enqueues them for feeding them later (also to the engine) when the engine requests them. Downloader¶ The Downloader is responsible for fetching web pages and feeding them to the engine which, in turn, feeds them to the spiders. Spiders¶ Spiders are custom classes written by Scrapy users to parse responses and extract items (aka scraped items) from them or additional requests to follow.
Item Pipeline¶ The Item Pipeline is responsible for processing the items once they have been extracted (or scraped) by the spiders. Downloader middlewares¶ Use a Downloader middleware if you need to do one of the following: L’homme le plus connecté du monde s’est fait dévorer par ses données. HOW - Face to Facebook. How we did it Through special custom software we collected data from more than 1,000,000 Facebook users.

What we collected is their "public data" - some of their personal data (name, country, Facebook groups they subscribe to) plus their main profile picture and a few friend relationships. We built a database with all this data, then began to analyze the pictures that showed smiling faces. The vast majority of pictures were both amateurish and somehow almost involuntarily or unconsciously alluring. And they are almost always "smiling". It's also evident that the majority of users want to appear in the best shape and look. Big Bang Data. OLGA SUBIRÓS STUDIO. We all generate data, with our mobile phones, sensors, social networks, digital photographs and videos, purchase transactions and GPS signals.
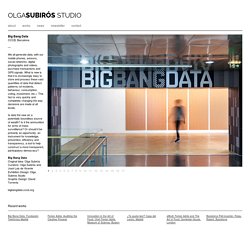
What is new is that it is increasingly easy to store and process these vast quantities of data that detect patterns (of incidents, behaviour, consumption, voting, investment, etc.). This fact is very quickly and completely changing the way decisions are made at all levels. Is data the new oil, a potentially boundless source of wealth? Is it the ammunition for arms of mass surveillance? Or should it be primarily an opportunity, an instrument for knowledge, prevention, efficiency and transparency, a tool to help construct a more transparent, participatory democracy? Big Bang Data Original Idea: Olga Subirós Curators: Olga Subirós and José Luis de Vicente Exhibition Design: Olga Subirós Studio Graphic Design: David Torrents. Selfiecity London. How we collected and filtered the data To locate selfies photos, we randomly selected 140,000 photos (20,000-30,000 photos per city) from a total of 808,000 images we collected on Instagram. 2-4 Amazon’s Mechanical Turk workers tagged each photo.

For these, we asked Mechanical Turk workers the simple question "Does this photo shows a single selfie"? We then selected top 1000 photos for each city (i.e., photos which at least 2 workers tagged as a single person selfie). We submitted these photos to Mechanical Turk again, asking three "master workers" (i.e. more skilled workers) not only to verify that a photo shows a single selfie, but also to guess the age and gender of the person.
On the resulting set of selfie images, we ran automatic face analysis, supplying us with algorithmic estimations of eye, nose and mouth positions, the degrees of different emotional expressions, etc. As the final step, one or two members of the project team examined all these photos manually. Selfiexploratory. The upper part shows charts that you can use as , while the lower part displays the .
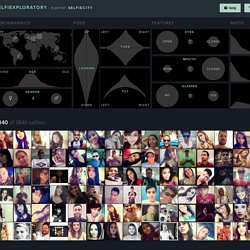
Click on any of the circles to see only selfies taken in that city. Clicking on the map background will remove the filter. You can navigate through the results grid using the on the left and right. Note how the other charts react when you filter the data! Click and drag the mouse to create a filter. Erica Scourti. Big Bang Data. Big Bang Data & Electronic Superhighway. S01E01 - Do Not Track. La culture à la merci des algorithmes? Inutile de le cacher plus longtemps: vous avez un sérieux penchant pour les films avec Scarlett Johansson.

Netflix le sait. Au bureau, vous écoutez Lilly Wood & the Prick. Deezer le voit tous les jours. Et pour votre anniversaire, le 27 janvier, vous vous offrirez l'autobiographie de Zlatan Ibrahimovic. Amazon l'a déjà emballé. Comment ces sites Internet font-ils pour vous connaître si bien et anticiper vos choix? Comment la SNCF déploie le Big Data pour optimiser les flux de voyageurs. SNCF Gares & Connexions va se doter d'un cluster Hadoop pour analyser les données Wi-fi des gares.
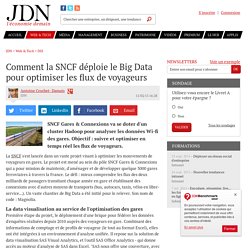
Objectif : suivre et optimiser en temps réel les flux de voyageurs. La SNCF s'est lancée dans un vaste projet visant à optimiser les mouvements de voyageurs en gares. Le projet est mené au sein du pôle SNCF Gares & Connexions qui a pour mission de maintenir, d'aménager et de développer quelque 3000 gares ferroviaires à travers la France.