

Google Analytics Tutorial – Understanding Traffic Acquisition. Google Analytics is a powerful tool.
But just like any other tool, it is only as good as the person using it. While some people are able to gain great insight through its creative usage, others are not able to move beyond page views and visits. In this post I am going to share some tips which can help you in getting the most out of Google Analytics reports on traffic acquisition. In the analytics world, the word ‘why’ always come before ‘what’ or anything else.
Google Analytics Configuration Mistake #2: Query String Variables. In my previous post I discussed how an incorrect Default Page setting can cause a single page on your website to be counted as two different pages.
That same concept is the driving force behind Common Google Analytics Configuration Mistake #2. If your website uses query string parameters you may be creating hundreds or thousands of unique page views which don’t actually exist. Google Analytics creates a unique page view using the path name, the file name and any query string parameters present in the location bar of the browser. Remember, the query string parameters are all the junk after the question mark. GA strips the domain name from the URL and the remaining info becomes a unique page. This URL: Results in this page view:/dir/index.php? And this URL: Results in this page view:/dir/index.php? The concept here is that the query string parameters do not tell us anything about the visitor’s actions. Just enter a comma separated list of the parameters in the field I’ve outlined above.
The Complete Google Analytics Event Tracking Guide Plus 10 Amazing Examples » Over my time working with Google Analytics accounts I have come across many reasons to use Event Tracking, so much so that I now wonder why there are still websites out there that do not utilise this fantastic resource.
Here, I’m going to explain what it is, the benefits, the code and examples, covering my favourite things to use Event Tracking for. Monitoring & Analyzing Error Pages (404s) Using Analytics. I recently wrote a post on the Google Analytics + page about monitoring error pages on websites. The post was well received and generated a healthy discussion on Google+, so I decided to write a more detailed article on the subject here.
First of all, what exactly is an error or 404 page? According to Wikipedia “The 404 or Not Found error message is a HTTP standard response code indicating that the client was able to communicate with the server, but the server could not find what was requested.” Or, in more general terms, the 404 is the error you get when the page you are looking for does not exist, usually because the link you clicked was broken. Another important question is: why should I care? In this post I propose a few techniques to help improve error pages, engage visitors and improve the website experience. Visualizing Google Analytics Data With Fusion Tables. Have you ever secretly wished to do crazy visualizations with your Google Analytics data?

I am sure you have! Well, there are several ways to do that, the most powerful being the Google Analytics API in conjunction with powerful visualization tools. However, sometimes visualization tools may require technical knowledge or are just too expensive. 10 Actionable Google Analytics Tips. Since July 2013, I have been publishing weekly tips on the official Google Analytics Google+ page.
I try to keep them very actionable, i.e. something that you can do right after reading the tip. They usually have two paragraphs explaining how to do something, a link for more information and an image showing how to get there or the results you will get. Some of the tips receive more interaction than others and I believe this is a reasonable proxy for how valuable they are, so I decided to find out the Top 10 tips and share them in one single post. That got me thinking about how to rank the tips... here are the factors that I considered: Post timing: since I consider this a column, like in any other publication it has a specific day/time. So here we go, the top 10 Google Analytics tips I shared in the last 6 months... and don't be shy, if you like any of the tips feel free to share them :-) 1. 2. 3. 4. 5.
Tracking offline advertising campaigns with Google Analytics. Measuring the activity generated by offline ad campaigns can be a difficult prospect.
Considering the costs involved with direct mail, or placing television, radio, and print ads, it’s important to get a good idea of the results of your ad campaigns — and your potential ROI. We all know that Google Analytics is a great website analytics tool for tracking website activity. But what most people don’t know is that you can also use Google Analytics to track the results of your offline ad campaigns. Google Analytics URL Builder The key is to use GA’s link tagging tools and web page redirects. How to Use Google Analytics Content Grouping: 4 Business Examples. Content Grouping is a useful feature that let’s you group your website or app content together and view aggregate metrics for each group.
This is particularly useful if you have a lot of content to analyze. Rolling up your content, based on your specific business structure, is very helpful when creating dashboards and other custom reports. In this post I’ll talk about how to actually use the data and walk through some examples for various business types. The Google Analytics Conversion Funnel Survival Guide. Every online business has steps that people must take to become a customer.
You can say that ad supported businesses are an exception – and that’s true, because people who click on ads aren’t customers! Whether people are attempting to sign up for your online service, or purchase a product from your website, there will be a certain number of steps they will have to take in order to give you money. Funnels help us see this process (or processes) easily, by giving us a visual representation of the conversion data between each step. This allows us to: Determine what steps are causing customer confusion or trouble.Figure out what language or copy might be altering our customer’s emotional behavior during checkout or sign up.To be aware of bugs, browser issues and other technical nuisances.
A New Method to Track Keyword Ranking using Google Analytics. In the past I’ve written about different ways to customize Google Analytics for SEO.
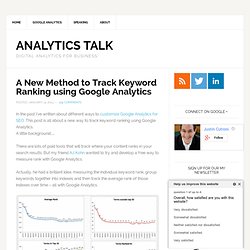
This post is all about a new way to track keyword ranking using Google Analytics. A little background… There are lots of paid tools that will track where your content ranks in your search results. But my friend AJ Kohn wanted to try and develop a free way to measure rank with Google Analytics. Actually, he had a brilliant idea: measuring the individual keyword rank, group keywords together into indexes and then track the average rank of those indexes over time – all with Google Analytics.
Track the SEO rank of keyword groups, or indexes, using Google Analytics.Image courtesy of AJ Kohn. Tracking Long tail keywords through Google Analytics. Many SEOs agree that there is power in the long tail.
There are also several solid stats to back up this claim. Recently i was asked one question and i think the same question bothers you too: There may be millions of ‘rare’ search terms in the tail, but the important things to ask are how much of the traffic they generate is relevant to a particular business and is there enough ROI to make it worth spending to chase those searches – Ivor Morgan (Head of Sales & Marketing at Morpheus Limited, UK) You may have been waiting for reports like these for a long long time: Here majority of one word keyword phrases are brand terms. Let us look further: The revenue is coming from four and five words keyword phrases. The revenue is coming from six, seven and eight words keywords phrases. You can see revenue even from nine words keywords phrases. A New Method to Track Keyword Ranking using Google Analytics. Google Universal Analytics: A User-Centric Approach. So, you are amazed at how Amazon personalizes their customer experience.
And you have read article after article on how effective 1-to-1 marketing can be. Yet, when you review your own marketing initiatives, there is suddenly that realization that this personalization element is totally missing. When assessing your current digital marketing initiatives, you may find the following. You are doing well at Your paid search campaigns, you are targeting searchers at various stages of the buying cycle with relevant ad copy and landing pages. You are not doing so well at You have little or no visibility into the behavior of repeat members and buyers.You have no idea how your customers interact across your different platforms (website, mobile, in-store, loyalty cards, etc.)The user-centric view of your customers (that you fantasized about after finishing your MBA) is a bit harder to get than you thought. Richer Insights For B2B Marketing With Google Analytics. The following is a guest post from Google Analytics Certified Partner Feras Alhlou, Partner & Principal Consultant at E-Nor Inc.
Marketers and sales professionals want to know who’s visiting their site, what content the target audience is consuming and what converts site visitors to paying customers. In a B2B environment -- where long sales cycles and multiple stakeholders affect sales decision -- “knowing who’s coming to your site” takes on another dimension. Say you’re in charge of marketing an eLearning system, and your target market includes telecom, hi-tech/software companies and universities.
Your sales cycle could span several months, and there are multiple personas/stakeholders who will evaluate your company and your product. Some key personas include: As a marketer, your job is to ensure your site addresses the needs of each stakeholder, while realizing that the interests/questions each group of stakeholders are likely to be different.
But don’t fret.