

Food and Ag Vulnerability Index - Shows Potential Risk to Supply as Result of Worker Illnesses from COVID19. In collaboration with Microsoft The Department of Agricultural Economics at Purdue University, in collaboration with Microsoft, has created an online dashboard, built on top of Microsoft Azure and Power BI platforms, to quantify the potential risk to the supply of agricultural products as a result of farm and agricultural worker illnesses from COVID19.
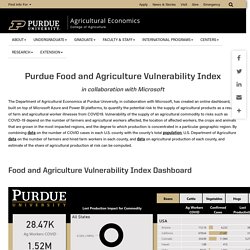
Vulnerability of the supply of an agricultural commodity to risks such as COVID-19 depend on the number of farmers and agricultural workers affected, the location of affected workers, the crops and animals that are grown in the most impacted regions, and the degree to which production is concentrated in a particular geographic region. Home Ag Economy Barometer - Nationwide Measure of the Health of the U.S. Agricultural Economy. USDA - National Agricultural Statistics Service - Agricultural Prices. Food and Agriculture Organization of the United Nations. » The FAO Food Price Index* (FFPI) averaged 172.2 points in March 2020, down 7.8 points (4.3 percent) from February, though still 4.6 points (2.7 percent) higher than in March 2019.
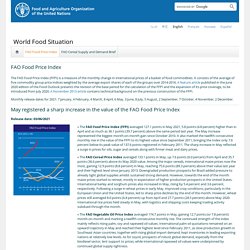
The sharp decline in March marked the second month-on-month drop in the value of the FFPI, largely driven by COVID-19 pandemic-demand contractions. While the latest fall in prices was most pronounced for vegetable oils and sugar, the other sub-indices also registered lower values in March. » The FAO Cereal Price Index averaged 164.6 points in March, down 3.2 points (1.9 percent) from February and now almost at the same level as in March 2019, as export prices of all the major cereals, except rice, fell for the second consecutive month. Wheat prices averaged lower in March compared to February despite worries over COVID-19, which boosted trade activity, especially by countries in North Africa, and the imposition of some export limitations, albeit small, by the Russian Federation. ITC (International Trade Centre) Agriculture Market Price.
Mintec Category Indices. This website stores cookies on your computer.
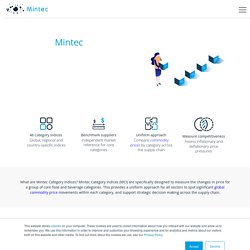
These cookies are used to collect information about how you interact with our website and allow us to remember you. We use this information in order to improve and customize your browsing experience and for analytics and metrics about our visitors both on this website and other media. To find out more about the cookies we use, see our Privacy Policy. Mintec Category Indices Compare commodity price changes by category, in order to measure price competitiveness. order to measure price competitiveness.
Mintec Category Indices 46 Category Indices Global, regional and country-specific indices Benchmark suppliers Independent market reference for core categories. Daily Livestock Report. FAO Meat Price Index. The FAO Meat Price Index - November 2019 The FAO Meat Price Index* averaged 190.5 points in November, up 8.4 points (4.6 percent) from October, representing the largest month-on-month increase since May 2009.
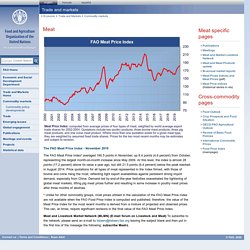
At this level, the index is almost 28 points (17.2 percent) above its value a year ago, but still 21.5 points (9.4 percent) below the peak reached in August 2014. Price quotations for all types of meat represented in the Index firmed, with those of bovine and ovine rising the most, reflecting tight export availabilities against persistent strong import demand, especially from China. Farmobile Index - Crop Progress + Benchmarking Tool with Daily, State-Level Crop Insights – Ground-Truthed Data. Global Food Security Index (GFSI) Climate Prediction Center - Drought Monitoring: Palmer Drought Indices. GDT Events Results » GlobalDairyTrade. Explanatory Notes All information published on this page may be reproduced provided the user acknowledges Global Dairy Trade as the source.
Quantity sold is the total quantity sold in a Trading Event across all products, contract periods and sellers. IGC - International Grains Council Index. Cotton - Price Quotes and Indices. Cotlook A Index Cotlook "A" Far East index.

Cotton Risk Managment Network (CRMN) (Members Only) Provides Council members with one-stop delivery of the complete range of market data, news and analytical tools necessary to compete in today’s agricultural marketing environment. Market Prices AWP & Special Import Quota End of Day Prices Intra-Day Prices Spot Quotes Marketing Loan Program Values Week-to-date values of the AWP and Marketing Loan Gain. Monthly Prices Quick access to NCC's most popular price tables. Cotton Market Fundamentals and Monthly Cotton Price Outlook. National Restaurant Association. The National Restaurant Association's Restaurant Performance Index (RPI) is a monthly composite index that tracks the health of and the outlook for the U.S. restaurant industry.
Launched in 2002, the RPI is released on the last business day of each month. Latest RPI (released April 30, 2019) Rice Price Reports. International Sugar Organization. Mintec Category Indices. Christmas Dinner Index. Prices might be key to consumers’ decision on sticking to the traditional turkey this year Despite the recent rise in meat prices, the Mintec Christmas Dinner Index shows that a typical Christmas dinner will be marginally cheaper by 1% this year, compared to 2018.
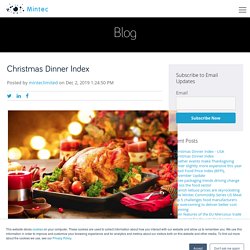
However, the entire Christmas meal will cost around 3% more, as more money will be needed for the turkeys and pigs in blankets. The higher priced main meal has been more than offset by, the cheaper puddings, as the lower prices of raisins, sugar and milk counterbalance the more expensive meats this year. From its large range of data coverage, Mintec is perfectly placed to track the prices of those food commodities that make it to a representative Christmas dinner and have blended all these in its Christmas Dinner Index.
Urner Barry Protein Price Indices.