

S&P Global Platts Launches New APSI 5 Dry Bulk Weighted Index. SINGAPORE, Feb. 2, 2021 /PRNewswire/ -- S&P Global Platts ("Platts"), the leading independent provider of information, analytics and benchmark prices for the commodities and energy markets, has launched a new dry bulk weighted average index – APSI 5 – for Supramax class bulkers, effective February 1, 2021.

APSI 5 is the dry bulk freight market's first regional weighted average index capturing the Asia Pacific trade on Supramax bulkers, reflecting an important segment of the global dry bulk market that is otherwise not reflected in existing price benchmarks. The new index enhances Platts' dry bulk freight market offering and complements the earlier launches of the Platts Capesize weighted average TCE Index (Cape T4) and Platts Kamsarmax weighted average TCE Index (KMAX 9). It offers participants the basis of an option to trade either a basket of routes via the Index, or the individual time charter equivalents (TCEs) as well as voyage charter rates.
Emerging Markets Logistics Index 2020. Transportation Services Index - Measures the Movement of Freight and Passengers. Logistics Managers Index - Score is Combination of Logistics Industry Eight Components. The World Bank - Logistics Performance Index - Ranks Countries on Efficiency of International Supply Chains. Global Trade Barometer. U.S. Import and Export Price Indexes.
Skip to Content.
TAC Index - Reference Price Information for Air Cargo Around the World - For Fee. Container Availability Index - Container xChange. U.S. Bank Freight Payment Index. Find out how to apply knowledge to future procurement cycles.

The idea that there's a strategy to paying bills might seem odd to some companies, but anyone involved in payment of freight bills knows otherwise. When and how bills are paid, how they're audited, and how the data from these invoices is leveraged are all critical considerations when processing freight bills. Jeff Pape, Senior Vice President of Global Transportation at U.S.
Bank, explains what a strategic approach looks like by breaking it down into six key steps. Make the decision to partner. Rail Traffic Data - Association of American Railroads. ACT For-Hire Trucking Index. The latest release of ACT’s For-Hire Trucking Index, with December data, showed improvement in for-hire freight volumes and utilization, with 55.5 and 52.3 respective diffusion index readings, both up four points from November on a seasonally adjusted basis.

But even as for-hire capacity contracted again, the Freight Rates Index slid to 48.7 in December. The ACT For-Hire Trucking Index is a monthly survey of for-hire trucking service providers. ACT Research converts responses into diffusion indexes, where the neutral or flat level is 50. Please contact us at trucks@actresearch.net if you are a for-hire executive interested in participating. In return, participants receive a detailed monthly analysis of the survey data, including Volumes, Freight Rates, Capacity, Productivity and Purchasing Intentions, plus a complimentary copy of our Transportation Digest report. Tim Denoyer, ACT Research’s Vice President and Senior Analyst commented, “We see encouraging signs that the Click below to: Rail Cost Indexes - Association of American Railroads. Indices by SONAR – FreightWaves. Drewry Port Throughput Indices. The Drewry Container Port Throughput Indices are a series of volume growth/decline indices based on monthly throughput data for a sample of over 220 ports worldwide, representing over 75% of global volumes.
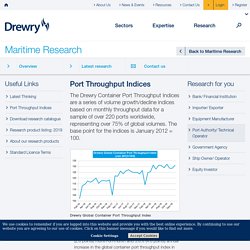
The base point for the indices is January 2012 = 100. Freight Rate Index - Freightos Baltic International Container Index. Xeneta Shipping Index - Worldwide Containerized Shipments. We are happy to share that we have officially launched our index-based contract offering, Xeneta Shipping Index (XSI™).
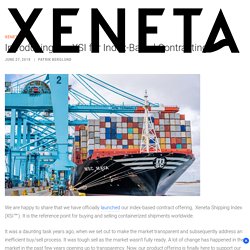
It is the reference point for buying and selling containerized shipments worldwide. It was a daunting task years ago, when we set out to make the market transparent and subsequently address an inefficient buy/sell process. It was tough sell as the market wasn't fully ready. A lot of change has happened in the market in the past few years opening up to transparency. Now, our product offering is finally here to support our vision. We have to date amounted over 65MN rates in our database, rich with long-term rates. We built Xeneta with the vision of making the shadowy world of rate fluctuations transparent. We have put together an internal team to drive forth index-linked contracting, the Customer Solutions team headed by Michael Braun.
BluJay Freight Market Index. Prologis Logistics Rent Index. Latin America Mexico saw soft real market rental growth.
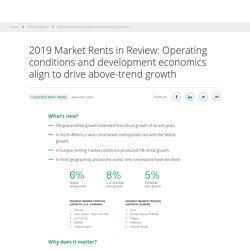
Logistics operating environments in the country’s six main markets remain mostly in equilibrium, as overall market vacancy remained stable at ~4.5%.2 Logistics real estate demand notably outpaced the broader economy. However, the global slowdown in manufacturing and weak domestic business confidence were drags on rents in 2019. Overall, market rental growth expanded slightly in 2019, but still was below CPI and less than what low vacancies and a healthy economic climate in the U.S. otherwise indicate. Bright spots are emerging in Brazil. Asia In Japan, rent growth held steady. In China, rental growth diverged between established and emerging markets. 2020: The Prologis research outlook Appendix: Concession levels globally Throughout this report, Prologis Research tracks rental rates on a net effective basis.
Exhibit 7CONCESSIONS, GLOBALMonths per year. JOC Market Data Hub. The Cass Freight Index: A Measure of North American Freight Activity. Cass Truckload Linehaul Index. A Measure of Market Fluctuations in Truckload Costs As the nation’s largest payer of freight bills, Cass manages more than $26 billion annually in freight spend, enabling Cass to compile meaningful logistics data that serves as an indicator of transportation industry trends.
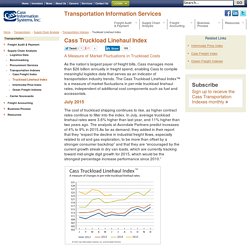
The Cass Truckload Linehaul Index™ is a measure of market fluctuations in per-mile truckload linehaul rates, independent of additional cost components such as fuel and accessorials. July 2015 The cost of truckload shipping continues to rise, as higher contract rates continue to filter into the index. In July, average truckload linehaul rates were 3.6% higher than last year, and 11% higher than two years ago. Ocean Freight Index. Cass Intermodal Price Index. FTR - Trucking Conditions Index (TCI) FTR’s Trucking Conditions Index (TCI) for March, at 7.3, reflects a continued softness due to the end of the large drops in fuel costs and a modest lessening of demand for truck services.

However, FTR expects conditions affecting trucking companies to rebound by summer as economic growth improves, truck demand stabilizes, and capacity tightens further. Downside risks for freight growth, such as currently weak manufacturing numbers, are being monitored closely by FTR and will be reflected in future TCI forecasts if warranted. inShare Click here to view the latest release and an interactive graph of the TCI > Jonathan Starks, FTR’s Director of Transportation Analysis, commented, "Conditions for truckers and fleets remains quite positive despite the recent dip in the index. FTR - Shippers Conditions Index (SCI) FTR’s Shippers Conditions Index (SCI) for February declined from January to a -1.0 reading, as the short term positive impact from one-time adjustments for rapidly dropping diesel prices and reversal of the 2013 Hours of Service changes runs out.
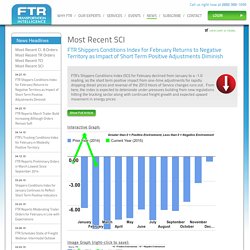
From here, the index is expected to deteriorate under pressures building from new regulations hitting the trucking sector along with continued freight growth and expected upward movement in energy prices. inShare The Shippers Conditions Index is a compilation of factors affecting the shippers transport environment. Any reading below zero indicates a less-than-ideal environment for shippers.
Readings below -10 signal that conditions for shippers are approaching critical levels, based on available capacity and expected rates. Click here to view the latest release and an interactive graph of the SCI> Truck Tonnage Index. Shanghai Shipping Exchange. TIANJIN SHIPPING INDEX. Baltic Exchange Freight Indices. Cookies are in use on www.balticexchange.com We use cookies on www.balticexchange.com to: Collect anonymous visitor statistics via Google Analytics to help us improve our site Allow you to choose how pages appear, choosing between options between viewing device types Your log in persistance What are these cookies called, and what do they do?
_utma - Tracks the number of times a visitor has been to the site, when their first visit was, and when their last visit occurred. _utmz - Tracks which site or search engine the visitor came from, the link clicked or keyword used, and the visitor's geographic location. _utmb + _utmc - Track how long a particular visit takes. These cookies are used by Google Analytics and help us understand how visitors interact with our website. The following cookies are required in order for the site to function correctly.