

Visualisation tools resource list, Anthony Judge and Nadia McLaren. Premier Software for Social Network Analysis. Mapping Social Networks. The growth of social networks such as Facebook and MySpace has introduced the idea of the 'social graph' into common parlance. the social graph is Watch this short video describing the proof of concept Vizter social network browser visualisation: Vizter explanatory video.
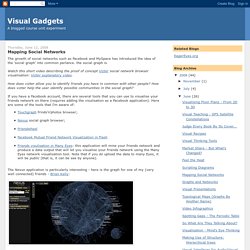
How does vizter allow you to identify friends you have in common with other people? How does vizter help the user identify possible communities in the social graph? If you have a Facebook account, there are several tools that you can use to visualise your friends network on there (requires adding the visulisation as a Facebook application). Hive Plots - Linear Layout for Network Visualization - Visually Interpreting Network Structure and Content Made Possible. Visualizing online social networks. Vizster: Visualizing Online Social Networks. VizsterVisualizing Online Social Networks Jeffrey Heer – jheer@cs.berkeley.edu Professor Marti Hearst InfoSys 247 – Information Visualization University of California, Berkeley Spring Semester, 2004 Vizster is an interactive visualization tool for online social networks, allowing exploration of the community structure of social networking services such as friendster.com [4], tribe.net [12], and orkut [10].
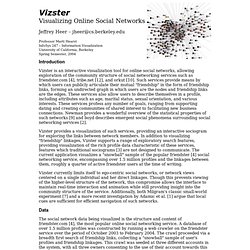
Such services provide means by which users can publicly articulate their mutual "friendship" in the form of friendship links, forming an undirected graph in which users are the nodes and friendship links are the edges. Network Visualization resources - tools. Gephi. Visualize your LinkedIn network. Analyser graphiquement son réseau facebook. Gephi est un outil puissant de modélisation de réseaux qui a également l’avantage de sa grande simplicité : pas besoin de compétences particulières pour l’utiliser, excepté une certaine curiosité !
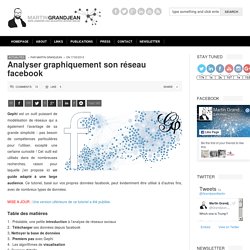
Cet outil est utilisés dans de nombreuses recherches, raison pour laquelle j’en propose ici un guide adapté à une large audience. Ce tutoriel, basé sur vos propres données facebook, peut évidemment être utilisé à d’autres fins, avec de nombreux types de données. MISE A JOUR : Une version ultérieure de ce tutoriel a été publiée. Table des matières Préalable, une petite introduction à l’analyse de réseaux sociauxTélécharger ses données depuis facebook 3. GraphTea, a Free and Open Source Graph Theory Software, for teachers and students. Wiki. Relations & Connections. The Opte Project. NNDB: Tracking the entire world. NodeXL: Network Overview, Discovery and Exploration for Excel - Home. NodeXL Graph Gallery. NodeXL. NodeXL is a free and open-source network analysis and visualization software package for Microsoft Excel 2007/2010.[2][3] It is a popular[n 1] package similar to other network visualization tools such as Pajek, UCINet, and Gephi.[5] Codebase[edit] Features[edit] Data Import[edit]
Mapping Twitter Topic Networks: From Polarized Crowds to Community Clusters. Polarized Crowds: Political conversations on Twitter Conversations on Twitter create networks with identifiable contours as people reply to and mention one another in their tweets.
These conversational structures differ, depending on the subject and the people driving the conversation. Six structures are regularly observed: divided, unified, fragmented, clustered, and inward and outward hub and spoke structures. These are created as individuals choose whom to reply to or mention in their Twitter messages and the structures tell a story about the nature of the conversation. 2013 NodeXL Social Media Network Analysis. 20120301 strata-marc smith-mapping social media networks with no co... Graphviz - Graph Visualization Software. Neo4j, the Graph Database - Learn, Develop, Participate.
Websites as graphs. Everyday, we look at dozens of websites.
The structure of these websites is defined in HTML, the lingua franca for publishing information on the web. Your browser's job is to render the HTML according to the specs (most of the time, at least). You can look at the code behind any website by selecting the "View source" tab somewhere in your browser's menu. HTML consists of so-called tags, like the A tag for links, IMG tag for images and so on. Nodus Labs. Hypergraph - Hyperbolic graphs and trees : Home. Linkurious. See Graph Databases Easily - Linkurious helps you to visualize your graph database through a simple web-based interface. We’re witnessing the rise of the graph in big data. GraphLab, a popular open source project dedicated to graph analysis and machine learning, is trying to capitalize on the excitement around graphs by spinning off a commercial entity, GraphLab Inc.
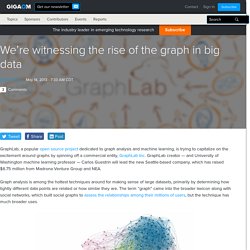
GraphLab creator — and University of Washington machine learning professor — Carlos Guestrin will lead the new Seattle-based company, which has raised $6.75 million from Madrona Venture Group and NEA. International Network for Social Network Analysis. Data Visualization Software. Visualizing RDF Schema inferencing through Neo4J, Tinkerpop, Sail and Gephi - Datablend. ATT_Labs_InternetMap_0730_10.pdf. Network Analysis And Visualization. Intro materials: network analysis software (UCINET, NodeXL, Gephi, Statnet, ERGM, RSiena) Statnet. Module - Dynamic Visualization of Social Networks. Data Visualization with graphviz. Designing responsive objects & spaces. The Internet is actually not a single network, but a collection of networks all owned by different network service providers and linked using some common protocols.
The arrangement of physical connections on a network depends on how you want to route the messages on that network. The simplest way is to make a physical connection from from each object in the network to every other object. That way, messages cab=n get sent directly from one point to another. The problem with this approach is the number of connections gets large very fast, and the connections get tangled. A simplier alternative to this is to put a central controller in the middle and pass all messages through this hub as in the star model.. This works as long as the hub continues to function, but the more objects you add, the faster the hub has to be to process all the message. Network Visualisation. NETDRAW. Action Science Explorer (Formerly iOpener Workbench) Latest News January 2012.
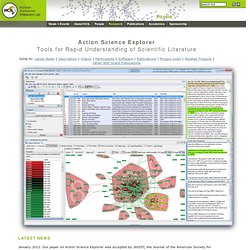
Our paper on Action Science Explorer was accepted by JASIST, the Journal of the American Society for Information Science and Technology. See the Publications section below for more details. December 2011. Action Science Explorer was featured in a NSF Discoveries report, "A New Visualization Method Makes Research More Organized and Efficient" (pdf). July 2010. Description The goal of the iOpener project is to generate readily-consumable surveys of different scientific domains and topics, targeted to different audiences and levels. Action Science Explorer is partially an integration of two powerful existing tools the SocialAction network analysis tool and the JabRef reference manager.
These tools are linked together to form multiple coordinated views of the data. SNAP: Stanford Network Analysis Project. Touchgraph.com. Social Networks. App. Algopol. The R Project for Statistical Computing. Network Visualization. Immersion by the MIT Media Lab is a view into your inbox that shows who you interact with via email over the years.
Immersion is an invitation to dive into the history of your email life in a platform that offers you the safety of knowing that you can always delete your data.Just like a cubist painting, Immersion presents users with a number of different perspectives of their email data. It provides a tool for self-reflection at a time where the zeitgeist is one of self-promotion. It provides an artistic representation that exists only in the presence of the visitor.
It helps explore privacy by showing users data that they have already shared with others. Twitter Co. Conversations. Social network visualization. Visualization Techniques for Categorical Analysis of Social Networks with Multiple Edge Sets Tarik Crnovrsanin, Chris W.

Muelder, Robert Faris, Diane Felmlee, and Kwan-Liu Ma Social Networks Volume 37, 2014, pp. 56-64 The growing popularity and diversity of social network applications present new opportunities as well as new challenges. Multivariate Social Network Visual Analytics Chris W. Multivariate Networks, Springer Verlag Multivariate Networks, Springer Verlag, 2014.