Social network analysis software
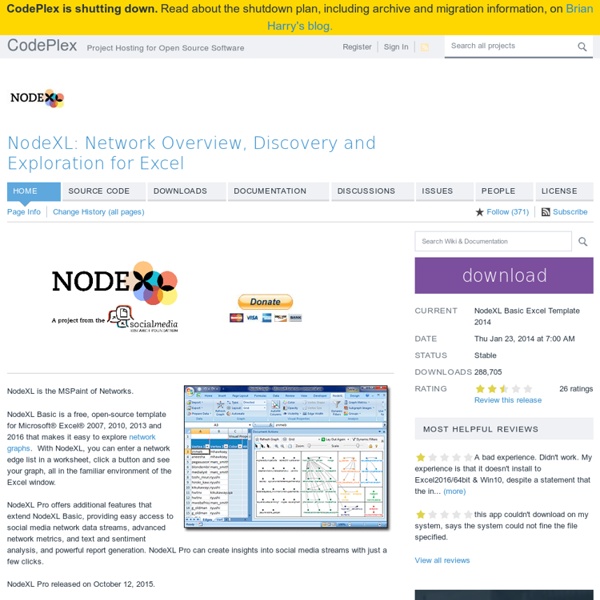
Social network analysis software (SNA software) is software which facilitates quantitative or qualitative analysis of social networks, by describing features of a network either through numerical or visual representation. Overview[edit] Some SNA software can perform predictive analysis.[5] This includes using network phenomena such as a tie to predict individual level outcomes (often called peer influence or contagion modeling), using individual-level phenomena to predict network outcomes such as the formation of a tie/edge (often called homophily models[6]) or particular type of triad, or using network phenomena to predict other network phenomena, such as using a triad formation at time 0 to predict tie formation at time 1. Network analysis software generally consists of either packages based on graphical user interfaces (GUIs), or packages built for scripting/programming languages.
PANDA: A Newsroom Data Appliance 1.1.2 — panda 1.1.2 documentation
About¶ PANDA is your newsroom data appliance. It provides a place for you to store data, search it and share it with the rest of your newsroom. The PANDA Project is 2011 Knight News Challenge winner.
Weka 3 - Data Mining with Open Source Machine Learning Software in Java
Weka is a collection of machine learning algorithms for data mining tasks. It contains tools for data preparation, classification, regression, clustering, association rules mining, and visualization. Found only on the islands of New Zealand, the Weka is a flightless bird with an inquisitive nature. The name is pronounced like this, and the bird sounds like this.
Aerobot - Machine Learning for Marketing and Social Media
When we started taking a look at their customer’s behavioral patterns, we noticed that each one of those customers tended to buy a specific set of products. We found movie fans, who love the 2x1 discount in tickets, a lot of foodies, who tend to pick some specific foods from sushi to barbecue, and others who love shopping, enjoying some great discounts in clothing and accesories. This caused an interesting problem: As the number of users and products grew, the brand started feeling generic and not really tailored to anyone in particular. This posed the question: How do we make each one of those individuals feel identified with the brand?
Navicrawler
UPDATE: There now a portable version of Firefox with Navicrawler included: More information on these: These folders are zipped. Unzip and run “Firefox Portable”.
38 Tools For Beautiful Data Visualisations
As we enter the Big Data era, it becomes more important to properly expand our capacity to process information for analysis and communication purposes. In a business context, this is evident as good visualisation techniques can support statistical treatment of data, or even become an analysis technique. But also, can be used as a communication tool to report insights that inform decisions. Today there are plenty of tools out there that can be used to improve your data visualisation efforts at every level. Below we list a non-exhaustive list of resources. Javascript Libraries
Tangle: a JavaScript library for reactive documents
Tangle is a JavaScript library for creating reactive documents. Your readers can interactively explore possibilities, play with parameters, and see the document update immediately. Tangle is super-simple and easy to learn. This is a simple reactive document.
Top Visual Search Engines: The Most Interesting Ways To Visually Explore Search Engine Results
1. Grokker Grokker is a web-based search engine that allows you to explore your results in a visual fashion. Your results are displayed both in a standard outline and in a dynamic map you can interact with. Grokker takes advantage of Yahoo!, Wikipedia, and Amazon Books search engines to perform its queries. Results can be sorted by date, source, domain and refined selecting (or excluding) specific related keywords.


