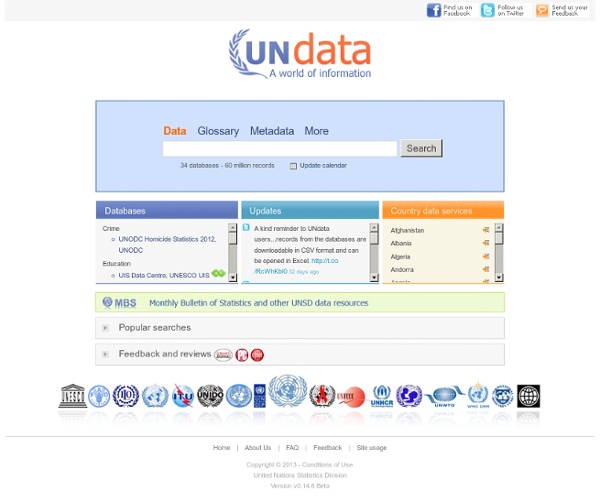


http://data.un.org/Default.aspx
Infographie – Facebook vs Twitter en 2010 Le blog de Camille Jourdain "Du marketing sur le web… et sur les médias sociaux." « Application Mobile : guides urbains et communautaires – Yescitiz Community Manager, qui es-tu ? Interview #9 » Un état des lieux de l’Open Data David Eaves, conseiller auprès de plusieurs institutions pour l'ouverture des données, a profité de son discours inaugural à l'Open Data Camp 2011 de Varsovie pour dresser un bilan, et évoquer des pistes pour l'avenir. Où en est l’Open Data ? Au cours de mon récent discours d’inauguration à l’Open Data Camp (qui se tenait cette année à Varsovie), j’ai tenté de poursuivre l’intervention que j’avais faite lors de la conférence de l’an passé. Voici l’état des lieux que j’en dresse. Le franchissement du gouffre
Les médias sociaux et les PME - bilan Comme je l'ai indiqué dans un post précédent, j'ai réalisé un questionnaire à destination des responsables d'entreprise et responsables marketing afin d'avoir plus informations sur l’importance des médias sociaux comme stratégie d'entreprise au sein des PME. Ce questionnaire a été publié sur Viadéo, sur 9 hubs englobant près de 16500 membres. 40 entreprises ont répondu à ce formulaire; nombre relativement faible mais permettant de dégager des tendances intéressantes. Voici les principaux éléments de l'étude : 1 - Les responsables d’entreprise ou marketing ayant répondu à ce questionnaire ne se considèrent pas comme expert en médias sociaux (3%), mais 34% déclarent être un connaisseur avisé 2 - 80% des entreprises pensent que les médias sociaux sont une évolution de société, et ce quelque soit la taille de l’entreprise 3 - 80% considèrent qu’une stratégie en médias sociaux peut être utile pour leur entreprise
Les data en forme La veille des journalistes de données d'OWNI vous transporte cette semaine d'Espagne en Papouasie-Nouvelle-Guinée, et fait une escale à Neuilly-sur-Seine. L’Espagne aura l’honneur d’ouvrir le bal de notre veille “data” cette semaine. Non parce qu’elle accueille le G20 de Cannes cette année, mais parce que nous y avons trouvé bonne matière pour lui rendre cet hommage hebdomadaire : Open Data, visualisations et cartographie au menu ibérique. Mi data es tu data “Datos.gob.es est le portail national qui gère et organise le catalogue de l’information publique de l’Administration générale de l’État”. Cyber-acheteurs, que recherchez-vous ? Cet article a été posté par Louise Maton le 10 janvier 2011 à 9:11 Yahoo sortait le mois dernier une étude sur l’habitude de recherche des consommateurs avant d’acheter en ligne. Près de 2000 consommateurs ont participé à l’enquête à travers 5 secteurs de vente : L’alimentation, les produits de soin & beauté, les vêtements, la décoration d’intérieur, et les produits électroniques. Ces résultats tendent à prouver que plus l’investissement financier est élevé, plus le consommateur recherche des informations sur son futur achat.
Les data en forme La veille des journalistes de données d'OWNI vous fait cette semaine jouer au Rubik's Cube, classer les gouvernements ou encore faire le marathon de New York. Comble du luxe, vous pourrez même comparer la Bible et le Coran... Qu’il ait été pour vous un cauchemar ou une fascination, vous avez forcément été confronté à un moment de votre vie à ce casse-tête addictif : le Rubik’s Cube. Cette semaine, nous vous proposons de vous replonger dans ce jeu de logique et d’équilibre, dans une version data aussi osée que prometteuse. Générations X, Y, Boomers … Que Font-Ils Sur Internet Voici une infographie éditée par Pew Internet dans laquelle nous apprenons quelles sont les activités effectuées par les internautes en fonction de la génération à laquelle ils appartiennent. Pour ceux qui souhaitent une définition précise de ces différentes générations, j’avais écrit un billet incluant une présentation powerpoint très intéressante sur les quatre générations principales. Tags: boomers, generation x, generation y, infographie Catégorie: E-marketing
Open Data : j'ai tout compris ! Sur Internet, on a souvent l'impression de débarquer à l'improviste dans des conversations qui ont commencé sans nous. Les commentateurs et analystes de tous poils discutent entre initiés, emploient un vocabulaire qui apparaît bien mystérieux au commun des mortels. C'est vrai de tout domaine spécialisé, me direz-vous, et le numérique n'échappe pas à la règle. C'est vrai, mais l'espace numérique d'Internet appartient à tout le monde. Comme l'open data. Open data par ci, open data par là... de quoi parle t-on ?