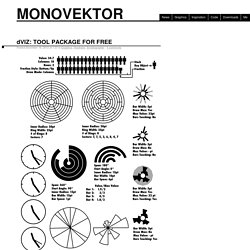

Monovektor. I have thrown together a collection of small scripts that could save some time when visualizing data.

I hope they can be helpful as, for most of them, there are no equivalent functions inherent in Illustrator – well, as far as I know. If you find these tools helpful; or have any suggestions of improvement; or ideas for other tools; or just about anything else – I’d appreciate comments. I have a few other useful scripts that I intend to add to this package in the future, but in the meantime here is a quick run-down on what the scripts so. Really the best thing to do is to try them out and play around. The package – as of 2012/12/29 – contains these scripts: - Analog Clock - Circular Bar Graph - Hyperbolic Line - Measures - Polar Grid - Polar Area / Pie Graph - Radiating Bars Graph - Stacks Download dViz Tools here.
ANALOG CLOCK – v1.01 Make analog clocks that display either the current time or time set by the user. 3D Map Online Designer - create maps, diagrams, infographics and illustrations from isometric icons. Insights. We use cookies to ensure you get the best experience in your interaction with our website.

Cookies help to provide a more personalized experience and relevant advertising for you, and web analytics for us. To learn more, and to see a full list of cookies we use, check out our Cookie Policy. Cookies are small text files that can be used by websites to make a user's experience more efficient. The law states that we can store cookies on your device if they are strictly necessary for the operation of this site. For all other types of cookies we need your permission.
This site uses different types of cookies. You can at any time change or withdraw your consent via the Cookie Policy on our website. Learn more about who we are, how you can contact us and how we process personal data in our Privacy Policy. Please state your consent ID and date when you contact us regarding your consent. Your consent applies to the following domains: www.datylon.com, help.datylon.com, insights.datylon.com.
Iconathon. Research - Brain Processing of Visual Information. CAMBRIDGE, Mass.

--Scientists at the Massachusetts Institute of Technology have discovered that an area of the brain previously thought to process only simple visual information also tackles complex images such as optical illusions. The research, conducted with animals, also provides evidence that both the simple and more complex areas of the brain involved in different aspects of vision work cooperatively, rather than in a rigid hierarchy, as scientists have believed to date. "Because half of the human brain is devoted directly or indirectly to vision, understanding the process of vision provides clues to understanding fundamental operations in the brain," said Professor Mriganka Sur of MIT's Department of Brain and Cognitive Sciences. The research, which will appear in the December 20 issue of the journal Science, was conducted by Professor Sur, graduate student Bhavin R.
Sheth, and postdoctoral fellows Jitendra Sharma and S. Mr. Infographie. Le pouvoir des infographies pour promouvoir votre entreprise. Il y a déjà un certain nombre d’années, un magazine avait axé toute sa communication sur cette simple phrase « le poids des mots, le choc des photos ». Dataviz.toolsdataviz.tools - a curated guide to the best tools, resources and technologies for data visualization. The 65 best infographics. Best infographics: Quick links The best infographics can take dry data, complex information or a confusing timeline, and make a clear as crystal graphic which is a joy to look at.

Infographics are almost the perfect encapsulation of what good design, illustration and animation are about: communicating a story or an idea visually, in a way that instantly connects with people, in a way that a lot of raw text can never do. If you're looking to create infographics yourself, then you'll probably want to look at our visualisation tools list. But before you get started, check out our selection of the best infographics on the web today, to get inspiration, ideas and motivation. We've divided these into categories, use the links to your right to jump from section to section. Okay, ready to get meta? Data Visualization Grammar.
Pourquoi et comment réaliser un rapport annuel créatif ? Le rapport annuel dans tous ses états C’est un exercice obligatoire pour les sociétés cotées en Bourse, mais recommandées pour toutes celles qui installent un climat de transparence en leur sein, le rapport annuel d’activités fleurit tous les ans à la même époque.

Il clôture le bilan comptable de l’entreprise. Son contenu doit faire apparaître : le bilan d’activités ainsi que les perspectives financièresle rapport d’actions marquant l’année passé et celles à venirla stratégie adoptée par l’entreprise et éventuellement les valeurs qu’elle prôneles intérêts de l’entreprise dans d’autres sociétés en précisant leurs pourcentages Tous ces éléments sont à regrouper dans le rapport d’activités qui doit être déposé au greffe du tribunal de commerce pour toutes les sociétés cotées en Bourse. Qui rédige le rapport annuel d’activités ? Ce sont les mandataires sociaux , c’est à dire le gérant, ou encore le président… de l’entreprise qui prennent en charge cette responsabilité. A Non-Designer s Guide to Creating Memorable Visual Slides by Visme. 42 ressources et logiciels pour créer une infographie.