
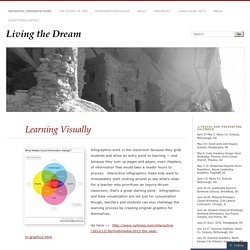
Processing DataVis. Dataviz&opendata. iCorsi demo. Learning Visually. Infographics work in the classroom because they grab students and allow an entry point to learning — and because they sum up pages and pages, even chapters, of information that would take a reader hours to process.
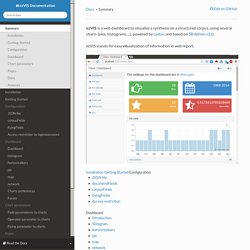
EzVIS Documentation. EzVIS is a web dashboard to visualize a synthesis on a structured corpus, using several charts (pies, histograms, ...), powered by castor, and based on SB Admin v2.0. ezVIS stands for easy visualization of information in web report.
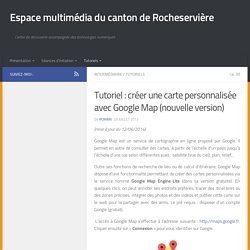
Installation Getting Started Configuration Dashboard Chart parameters. Créer une carte personnalisée avec Google Map (nouvelle version) (mise à jour du 12/06/2014)
Plotly. Tree Visualization. Data Maps. Data journalism tools. How to Make Bubble Charts. Visualization tools. Social Network Data in R. Nathan J.
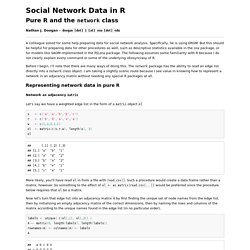
Doogan – doogan [dot] 1 [at] osu [dot] edu A colleague asked for some help preparing data for social network analysis. Specifically, he is using ERGM. But this should be helpful for preparing data for other procedures as well, such as descriptive statistics available in the sna package, or for models like SAOM implemented in the RSiena package. The following assumes some familiarity with R because I do not clearly explain every command or some of the underlying idiosyncrasy of R. Circle Packing. GRAPHIC DESIGN /DATA VIZ. Sans titre.
GoJS Diagramming for JavaScript and HTML, by Northwoods Software. Charted. StoryMap JS - Telling stories with maps. Wiki. OpenStreetMap. Graphviz. Un article de Wikipédia, l'encyclopédie libre.
Graphviz est un logiciel libre distribué suivant la licence Common Public License. Voir aussi[modifier | modifier le code] Liens externes[modifier | modifier le code] (en) Site web de Graphviz Extensions et dérivés[modifier | modifier le code] Documentation[modifier | modifier le code] (fr) Génération de graphes avec GraphViz (Hugo Etiévant, 2004) v0.99 Preview: Graphviz and DiagrammeR. Soon after the announcement of htmlwidgets, Rich Iannone released the DiagrammeR package, which makes it easy to generate graph and flowchart diagrams using text in a Markdown-like syntax.
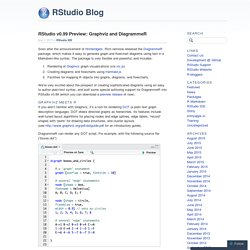
The package is very flexible and powerful, and includes: Rendering of Graphviz graph visualizations (via viz.js)Creating diagrams and flowcharts using mermaid.jsFacilities for mapping R objects into graphs, diagrams, and flowcharts. We’re very excited about the prospect of creating sophisticated diagrams using an easy to author plain-text syntax, and built some special authoring support for DiagrammeR into RStudio v0.99 (which you can download a preview release of now). Graphviz Meets R DiagrammeR can render any DOT script. Mapping techniques with R. DataVisualization.
Graphe Interactif INFOVIS Java script Toolkit. 15 Data Visualizations That Will Blow Your Mind. If a picture is worth a thousand words, a data visualization is worth at least a million.
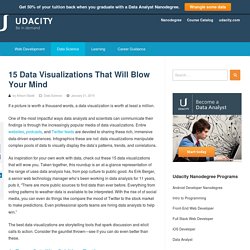
One of the most impactful ways data analysts and scientists can communicate their findings is through the increasingly popular media of data visualizations. Entire websites, podcasts, and Twitter feeds are devoted to sharing these rich, immersive data-driven experiences. Datavisualization.ch Selected Tools. GUI Architectures. There have been many different ways to organize the code for a rich client system.

Here I discuss a selection of those that I feel have been the most influential and introduce how they relate to the patterns. Graphical user interfaces have become a familiar part of our software landscape, both as users and as developers. Le Web comme un espace - Alexis Jacomy, @SudWeb 2015. Gephi - The Open Graph Viz Platform. MedialabSciences Po. Atelier ICEBERG - from Data to Vision.
Sigma js. Classroom - Udacity. D3.js tutorial - 15 - The Tree Layout (2/2) d3. D3.js tutorial - 1 - Introduction. Introduction to D3. Data Visualization and Infographics with D3.js - Knight Center JournalismCourses.org. Data Visualization and D3.js Course. Lesson 1a Visualization Fundamentals (2 hours) Learn about the elements of great data visualization.
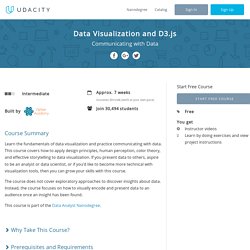
In this lesson, you will meet data visualization experts, learn about data visualization in the context of data science, and learn how to represent data values in visual form. Lesson 1b D3 Building Blocks (4 hours) Learn how to use the open standards of the web to create graphical elements. You’ll learn how to select elements on the page, add SVG elements, and how to style SVG elements. Infographics Lesson Plans. Create Easy Infographics, Reports, Presentations. Infographic Templates. Visualize your resume in one click. The 37 best tools for data visualization. It's often said that data is the new world currency, and the web is the exchange bureau through which it's traded.
As consumers, we're positively swimming in data; it's everywhere from labels on food packaging design to World Health Organisation reports. As a result, for the designer it's becoming increasingly difficult to present data in a way that stands out from the mass of competing data streams. Get Adobe Creative Cloud One of the best ways to get your message across is to use a visualization to quickly draw attention to the key messages, and by presenting data visually it's also possible to uncover surprising patterns and observations that wouldn't be apparent from looking at stats alone. Babylon.js.
Sans titre. Tutorial - Gephi. Gephi - The Open Graph Viz Platform. Vizualize.me: Visualize your resume in one click. Free Infographic Maker - Venngage. D3.js - Data-Driven Documents. Hour of Code. Hints after video one. This may never be seen? Draw a picture made of ellipses and rectangles! For example, you could make a self-portrait, an alien creature, or something more abstract. It'll just be black and white for now, we'll get to color in the next video.
You can work on your own pace, but we recommend approximately ten minutes on this assignment before moving on. Reminders To draw a rectangle: rect(a,b,c,d); To draw an ellipse: ellipse(a,b,c,d); a — X (horizontal) location of the shape's upper-left cornerb — Y (vertical) location of the shape's uppper-left cornerc — width of the shaped — height of the shape For more, check out the rectangle and ellipse pages on processing.org. Add color to your design! Front End Developer Playground & Code Editor in the Browser. Three-way MV* Data Binding with AngularJS and Firebase One of the hallmark features of the AngularJS framework is its "two-way binding" of data, a trick that makes handling dynamic data in a single page application (SPAs) fast... Grokking quadratic bézier curves in SVG Hey CodePen party people, today I want to talk to you about quadratic curves in the SVG path element.
Data Visualization and D3.js Course - Udacity. Sans titre. This is a full time, salaried position, based in Paris. If you wish to apply, please send us an email with your CV, LinkedIn profile, your portfolio or GitHub repository at contact@dataveyes.com. Role We are looking for an experienced interface developer, more than an expert in data visualization. Your responsibilities will include: Taking a key part in the development of advanced data visualization solutions, from robust technical architecture down to pixel perfect interfaces.Defining strategies and implementing processes to build high-value technology components.Bringing to life new visual and interactive systems to provide users with clarity and new ways of approaching complex data. Every Recorded Meteorite Impact on Earth. Free Data Visualization Software. Programming 3D Applications with HTML5 and WebGL. WebGL is the standard 3D graphics API for the web. It allows developers to harness the full power of the computer’s 3D rendering hardware from within the browser using JavaScript.
Before WebGL, developers had to rely on plugins or native applications and ask their users to download and install custom software in order to deliver a hardware-accelerated 3D experience. While WebGL is not in the official HTML5 specification, it is shipped with most browsers that support HTML5. Like Web Workers, Web Sockets and other technologies outside the official W3C recommendations, WebGL comes with the package; the developers at Google, Apple, Mozilla, Opera and Blackberry consider 3D an essential component for making the browser into a first-class application platform. WebGL works on the majority of desktops, as well as a growing number of mobile browsers. SVG animé. Animation et interaction Les SVG sont des documents dynamiques. Créer un graphique géographique avec Google Drive.
Créer une carte personnalisée avec Google Map (nouvelle version) Gapminder World Poster 2013. This chart compares Life Expectancy & GDP per capita of 182 nations in the year 2013. Each bubble is a country. Size is population. Color is region. People live longer in countries with a higher GDP per capita. No high income countries have really short life expectancy, and no low income countries have very long life expectancy. Click here to download. Enterprise Work Visualization is Here.
Downloads - Genias Graphics - exclusive distributor of Tecplot in Europe and Western Asia. Some Information Visualization Resources on the Web. TreeMap interactive data visualization software v. 3.6.1 released! JSON Editor Online - view, edit and format JSON online. Core.js. Philogb/v8-gl. Learning WebGL. Nicolas Garcia Belmonte's Blog. PhiloGL: A WebGL Framework for Data Visualization, Creative Coding and Game Development.
Graphe Interactif INFOVIS Java script Toolkit. Gephi - The Open Graph Viz Platform. Visual Understanding Environment. Welcome to DeepaMehta.