

FRAMEWORKS & LIBRARIES JavaScript. Tutorial - Creating an Interactive SVG map - Blog - Parallax. Over the past few years there’s been an increasing demand from our clients for interactive maps, whether it be for shopping centres, housing developments or just geographical maps.
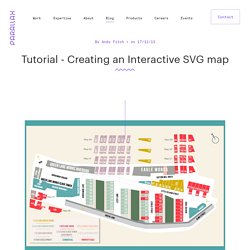
Most recently, I was tasked with creating a masterplan (architectural, not the evil villain kind) for Little Kelham, a property development at Kelham Island in Sheffield built by Citu. They needed two versions of the masterplan: a map to highlight the residential properties they have available, and a map for their commercial properties. Each plot needed to have its own well defined shape and have a hover state & click events. What am I making? In this tutorial we’re going to be drawing vector graphics in the browser using a combination of SVG (Scalable Vector Graphics) and an excellent JavaScript framework called Raphaël to create a map of the United Kingdom. SVG is supported in most browsers except IE8 and below. How will it look? View Demo Download the source. US State Map. Snap.svg Tutorial. Interactive Map with d3.js - TNODA.
This is an interactive map.

Please click United States, Japan or their states/prefectures to see zoom animation. Building Great Web Maps: A D3.js Tutorial. Data Driven Documents, or D3.js, is “a JavaScript library for manipulating documents based on data”.
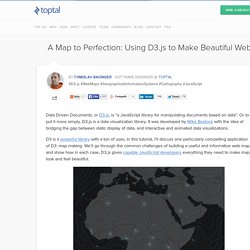
Or to put it more simply, D3.js is a data visualization library. It was developed by Mike Bostock with the idea of bridging the gap between static display of data, and interactive and animated data visualizations. D3 is a powerful library with a ton of uses. In this tutorial, I’ll discuss one particularly compelling application of D3: map making. We’ll go through the common challenges of building a useful and informative web map, and show how in each case, D3.js gives capable JavaScript developers everything they need to make maps look and feel beautiful. Datamaps/README.md at master · markmarkoh/datamaps. SVG To RaphaelJS Converter - Ready.Set.Raphael. Beta 2. JS Bin - Collaborative JavaScript Debugging. jQuery. Three.js - documentation - Manual - Creating a scene. Raphaël—JavaScript Library.
SVG Animations Using CSS and Snap.svg. Today I wanted to share with you the ease of animation in SVG with the tools we have available to us today.
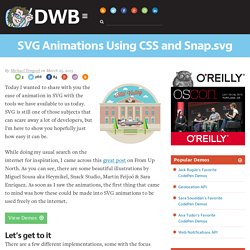
SVG is still one of those subjects that can scare away a lot of developers, but I'm here to show you hopefully just how easy it can be. While doing my usual search on the internet for inspiration, I came across this great post on From Up North. As you can see, there are some beautiful illustrations by Miguel Sousa aka Heymikel, Snack Studio, Martín Feijoó & Sara Enríquez.
As soon as I saw the animations, the first thing that came to mind was how these could be made into SVG animations to be used freely on the internet. JSLint,The JavaScript Code Quality Tool. Understanding the four layers of JavaScript OOP. JavaScript OOP is baffling: on one hand, there is a simple core, on the other hand, there are some really weird things going on.

I’ve been pondering for a long time how to explain it well and I think the best way to do so is via four layers: single objects, prototype chains, constructors, constructor inheritance. The first two layers are JavaScript’s simple OOP core, layers 3 and 4 are where the complications start. I’ve explained the four OOP layers in an O’Reilly webcast: Video on YouTube (starts later to avoid duplicated content at the beginning)SlidesFull webcast (requires Flash, but the audience’s comments in the chat are interesting) Additional material: “In defense of JavaScript’s constructors” explains my – conservative – recommendation of constructors“JavaScript’s ‘this’: how it works, where it can trip you up”Chapter “Objects and Inheritance” in the online version of “Speaking JavaScript” Tutorials · mbostock/d3 Wiki.
Wiki ▸ Tutorials Please feel free to add links to your work!!

Tutorials may not be up-to-date with the latest version 4.0 of D3; consider reading them alongside the latest release notes, the 4.0 summary, and the 4.0 changes. Introductions & Core Concepts Specific Techniques. Learning JavaScript Design Patterns. Design patterns are reusable solutions to commonly occurring problems in software design. They are both exciting and a fascinating topic to explore in any programming language.
One reason for this is that they help us build upon the combined experience of many developers that came before us and ensure we structure our code in an optimized way, meeting the needs of problems we're attempting to solve. Design patterns also provide us a common vocabulary to describe solutions. ImageMapster. ImageMapster is a jQuery plugin that lets you activate HTML image maps without using Flash.
It works just about everywhere that Javascript does, including modern browsers, Internet Explorer 6, and mobile devices like iPads, iPhones and Androids. Note: ImageMapster used to be distributed as a ZIP archive. You can still download the full package including examples and source as a zip from GitHub but I will no longer be building a version-specific ZIP file with each release. PLEASE STOP HOTLINKING! The Basics of Object-Oriented JavaScript.
Over recent years, JavaScript has increasingly gained popularity, partly due to libraries that are developed to make JavaScript apps/effects easier to create for those who may not have fully grasped the core language yet.

While in the past it was a common argument that JavaScript was a basic language and was very 'slap dash' with no real foundation; this is no longer the case, especially with the introduction of high scale web applications and 'adaptations' such as JSON (JavaScript Object Notation). JavaScript can have all that an Object-Orientated language has to offer, albeit with some extra effort outside of the scope of this article. JSbooks - free javascript books. DOM Inspector. Chartist - Simple responsive charts.
You may think that this is just yet an other charting library.
But Chartist.js is the product of a community that was disappointed about the abilities provided by other charting libraries. Of course there are hundreds of other great charting libraries but after using them there were always tweaks you would have wished for that were not included. Highly customizable responsive charts Facts about Chartist The following facts should give you an overview why to choose Chartists as your front-end chart generator: Snap.svg - Home. Browserify. Code Monster from Crunchzilla. Vivus.js - svg animation.