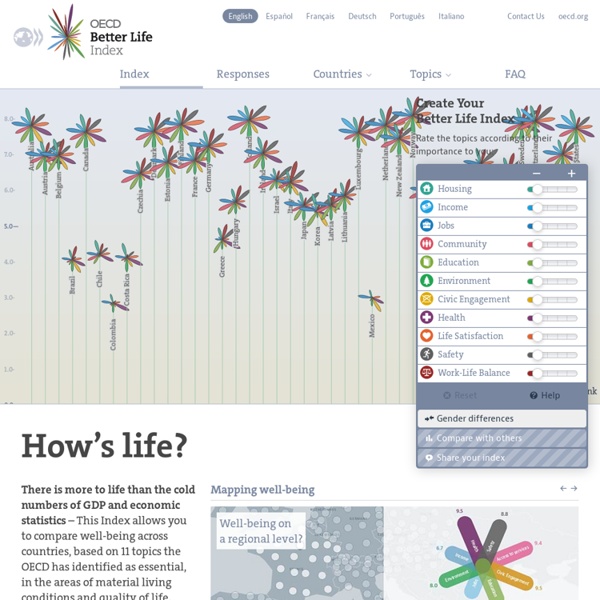


http://www.oecdbetterlifeindex.org/#/11111111111
Related: StatistikThe World Bank - Statistik World Development Indicators 2016 World Development Indicators (WDI) publication is a collection of time-series data for 214 economies, with many indicators going back more than 50 years. WDI provides cross-country comparable statistics about development and people’s lives around the globe. It is divided into six sections – World View, People, Environment, Economy, States and Markets, and Global Links. World Wealth Report 2011 Wealth and population of global HNWIs surpass pre-crisis levels in nearly every region as HNWI wealth reaches US$42.7 trillion The world’s high net worth individuals (HNWIs) expanded in population and wealth in 2010 surpassing 2007 pre-crisis levels in nearly every region, according to the 15th annual World Wealth Report from Merrill Lynch Global Wealth Management and Capgemini. The World Wealth Report covers 71 countries in the market-sizing model, accounting for more than 98% of global gross national income and 99% of world stock market capitalization. The report has built a strong and lasting reputation as the industry benchmark for HNWIs market sizing—originally at a global and regional level but increasingly at a country level. Download the Report to learn more about trends in HNWI wealth worldwide.
featured projects Quantified Other Five weeks of my father's Nike Fuel data Tatelets Generative bracelet based on artworks from Tate Modern Time to have your say: What World Do You Want? Time to have your say: What World Do You Want? 24/08/2012 at 11:40 am Rahm Emanuel once famously said that you never want a serious crisis go to waste. And you already know that we are going through a serious crisis, both at home and across the world. So the question is, what good can come out of this crisis? How Common Is Your Birthday? UPDATE: I’ve written a clarification about this post here. Please read it. A friend posted an interesting data table on my Facebook wall yesterday, which was my birthday. The data listed each day of the year with a ranking for how many babies were born in the United States on each date from 1973 to 1999.
Office for National Statistics (ONS) Output in the Construction Industry, November 2015 In November 2015, output in the construction industry was estimated to have decreased by 0.5% compared with October 2015. All new work was the largest contributor to the fall, decreasing by 0.7%, with repair and maintenance (R&M) falling 0.2%. The World Factbook People from nearly every country share information with CIA, and new individuals contact us daily. If you have information you think might interest CIA due to our foreign intelligence collection mission, there are many ways to reach us. If you know of an imminent threat to a location inside the U.S., immediately contact your local law enforcement or FBI Field Office. For threats outside the U.S., contact CIA or go to a U.S.
40 Essential Tools and Resources to Visualize Data One of the most frequent questions I get is, "What software do you use to visualize data?" A lot of people are excited to play with their data, but don't know how to go about doing it or even start. Here are the tools I use or have used and resources that I own or found helpful for data visualization – starting with organizing the data, to graphs and charts, and lastly, animation and interaction. Organizing the Data by sleepy sparrow The World We Want: 2015 A Public Forum on “The Privatization of the Post-2015 Development AgendaIssues and Challenges in Partnerships with the ‘Private Sector’” 8 April 2014, 1:15 – 2:45 PM 2nd Floor Conference Room, UN Church Center “Partnerships” for sustainable development are increasingly being promoted as a major, if not the primary, enabler for the implementation of the successor international sustainable development goals to replace the Millennium Development Goals (MDGs) by 2015. However, a growing number of civil society groups warn against a partnerships approach that places primary emphasis on enticing private sector partiipation and investments as this risks reinforcing the corporate capture of the post-2015 agenda.
An Interactive Look at Connected Devices in 2020 [INFOGRAPHIC] Whether it’s the Internet of Things and the rising connectivity among devices, or the use of wireless connections for machine-to-machine applications, you might be considering how this technology affects you and your organization. It’s important to know the sharing of valuable data by devices is expected to become an almost $1 trillion industry by 2020 , according to a report by the Carbon War Room. And in the next seven years, we’ll be measuring the growth in connected devices in more than just dollars. The following is a glimpse of what this technology might mean for your business in the future: That’s a lot of devices.
Great Britain Historical Documentation System/Home Page Available Parts: Information about Economic Distress and Labour Markets: The database includes a wide range of indicators of economic distress, most obviously unemployment and Poor Law statistics but also 'Small Debt Plaints' and the marriage rate. It also includes information on wages, hours of work and strikes in different localities. This part of the database includes some information about Ireland.