background preloader

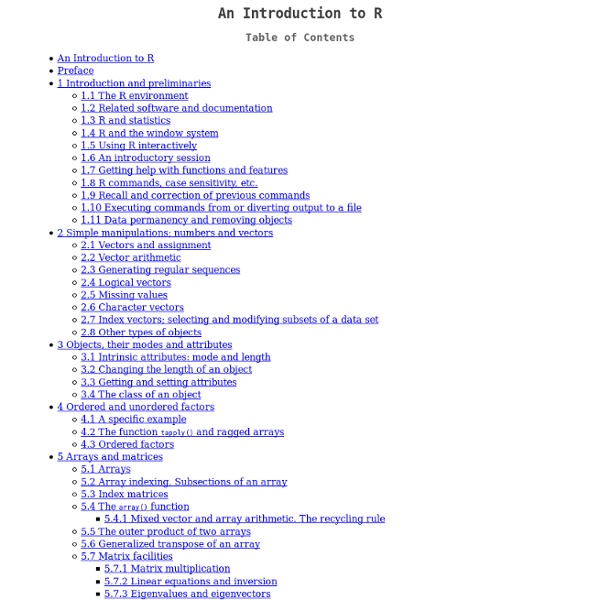
An Introduction to R

An Introduction to R
Table of Contents This is an introduction to R (“GNU S”), a language and environment for statistical computing and graphics. R is similar to the award-winning1 S system, which was developed at Bell Laboratories by John Chambers et al. This manual provides information on data types, programming elements, statistical modelling and graphics. This manual is for R, version 3.1.0 (2014-04-10). Copyright © 1990 W. Permission is granted to make and distribute verbatim copies of this manual provided the copyright notice and this permission notice are preserved on all copies. Preface This introduction to R is derived from an original set of notes describing the S and S-PLUS environments written in 1990–2 by Bill Venables and David M. We would like to extend warm thanks to Bill Venables (and David Smith) for granting permission to distribute this modified version of the notes in this way, and for being a supporter of R from way back. Comments and corrections are always welcome. 1.1 The R environment Related:  programming

LexRank: Graph-based Lexical Centrality as Salience in Text Summarization Güneş Erkan gerkan@umich.edu Dragomir R. Radev radev@umich.edu Department of EECS, School of Information University of Michigan, Ann Arbor, MI 48109 USA Abstract: We introduce a stochastic graph-based method for computing relative importance of textual units for Natural Language Processing. In recent years, natural language processing (NLP) has moved to a very firm mathematical foundation. In this paper, we will take graph-based methods in NLP one step further. Text summarization is the process of automatically creating a compressed version of a given text that provides useful information for the user. Extractive summarization produces summaries by choosing a subset of the sentences in the original document(s). Early research on extractive summarization is based on simple heuristic features of the sentences such as their position in the text, the overall frequency of the words they contain, or some key phrases indicating the importance of the sentences [Bax58,Edm69,Luh58]. where occurs. s .

The R programming language for programmers coming from other pro IntroductionAssignment and underscoreVariable name gotchasVectorsSequencesTypesBoolean operatorsListsMatricesMissing values and NaNsCommentsFunctionsScopeMisc.Other resources Ukrainian translation Other languages: Powered by Translate Introduction I have written software professionally in perhaps a dozen programming languages, and the hardest language for me to learn has been R. R is more than a programming language. This document is a work in progress. Assignment and underscore The assignment operator in R is <- as in e <- m*c^2. It is also possible, though uncommon, to reverse the arrow and put the receiving variable on the right, as in m*c^2 -> e. It is sometimes possible to use = for assignment, though I don't understand when this is and is not allowed. However, when supplying default function arguments or calling functions with named arguments, you must use the = operator and cannot use the arrow. At some time in the past R, or its ancestor S, used underscore as assignment. Vectors Sequences

Statistics Mattters - Jan 9 2011 - My first R package: zipcode Decisions, decisions Newcomb’s paradox is the name usually given to the following problem. You are playing a game against another player, often called Omega, who claims to be omniscient; in particular, Omega claims to be able to predict how you will pl... Newcomb’s paradox is the name usually given to the following problem. How to Prioritize Work: 7 Practical Methods for When "Everything is Important" One of the biggest struggles in the modern workplace is knowing how to prioritize work. Workloads are ballooning and everything feels important. However, the truth is that a lot of the work we do every day doesn’t really need to be done. Learning how to prioritize means getting more out of the limited time you have each day. But while the elements of prioritization are simple (i.e. To make things easier, we’ve collected some of the best strategies out there on how to prioritize work into one master list. RescueTime tells you exactly how you’re spending your time every day so you can prioritize the work that matters most. 1. Prioritization happens on different levels. Unfortunately, those lists don’t always match up. Start by making a master list—a document, app, or piece of paper where every current and future task will be stored. Once you have all your tasks together, it’s time to break them down into monthly, weekly, and daily goals. 2. In some cases it will come down to experience.

R Programming - Manuals R Basics The R & BioConductor manual provides a general introduction to the usage of the R environment and its basic command syntax. Code Editors for R Several excellent code editors are available that provide functionalities like R syntax highlighting, auto code indenting and utilities to send code/functions to the R console. Programming in R using Vim or Emacs Programming in R using RStudio Integrating R with Vim and Tmux Users interested in integrating R with vim and tmux may want to consult the Vim-R-Tmux configuration page. Finding Help Reference list on R programming (selection)R Programming for Bioinformatics, by Robert GentlemanAdvanced R, by Hadley WickhamS Programming, by W. Control Structures Conditional Executions Comparison Operators equal: ==not equal: ! Logical Operators If Statements If statements operate on length-one logical vectors. Syntax if(cond1=true) { cmd1 } else { cmd2 } Example if(1==0) { print(1) } else { print(2) } [1] 2 Avoid inserting newlines between '} else'. Loops Syntax

Node-level Calculations - Daizaburo Shizuka There are certain pre-packaged commands in statnet and igraph that allows you to calculate various node-level measures. The statnet package seems to have a more comprehensive list, though igraph has a couple of measures that statnet does not have. The biggest problems (for my purposes) are that igraph does not have a command for calculating information centrality, and neither package seems to have commands for reach or distance-weighted reach. The latter two are pretty straight-forward, so I am posting functions that will let you easily calculate those two measures. Here is a list of commands for node-level calculations included in the two packages. Reach and Distance-weighted Reach For igraph: Reach: 2-reach and 3-reach is simply the proportion of nodes you can reach within 2 steps or 3 steps, respectively. 2-reach: 3-reach: distance-weighted reach:

How Google and Facebook are using R Cambridge, Mass. – March 4, 2011 – Via Science announced the acquisition of Dataspora, a predictive analytics firm that helps companies solve complex big data problems. The acquisition helps strengthen Via Science’s positioning to support the consumer packaged goods and retail sectors, areas of focus for Dataspora. REFS™ provides the ability to leverage causal mathematics at scale with its supercomputing platform. This allows decision-makers to make better use of data with mathematical models that can diagnose problems or predict future outcomes. Via Science has invested over 10 years and $25 million to prove the value of REFS™ in high-stakes problem areas such as precision medicine and quantitative trading. Dataspora has experience leveraging predictive analytics in numerous industry verticals. Via Science has integrated the knowledge acquired, and will continue to target the core sectors Dataspora pioneered. About Via Science Via Science = Big (Math + Computing + Data)

Getting Started with Sweave: R, LaTeX, Eclipse, StatET, & TeXlipse Being able to press a single button that runs all your statistical analyses and integrates the output into your final report is a beautiful thing. If you have not already heard, this is what Sweave can do for you. However, getting your computer to run Sweave can be a little bit fiddly. Thus, this post: (1) sets out the benefits of Sweave; (2) sets out how to install and configure R, Sweave, and Eclipse on Windows; (3) lists resources for people wanting to learn more about how to use LaTeX and Sweave; and (4) lists some specific resources relevant to researchers in psychology wanting to use these tools. What is Sweave? To Sweave is to weave in S. Why Sweave? Reproducibility: The most important reason to adopt a tool like Sweave is to make your research more reproducible. Common Use Cases Statistics Instructional MaterialsEmpirical reports, journal articles, book chapters, theses, etc.Data sharing, literate programming, reproducible research, weaving: This is future of data analysis. 1. 2.

OpenStack Rtips. Revival 2012! Paul E. Johnson <pauljohn @ ku.edu> The original Rtips started in 1999. You are reading the New Thing! The first chore is to cut out the old useless stuff that was no good to start with, correct mistakes in translation (the quotation mark translations are particularly dangerous, but also there is trouble with ~, $, and -. (I thought it was cute to call this “StatsRus” but the Toystore’s lawyer called and, well, you know…) If you need a tip sheet for R, here it is. This is not a substitute for R documentation, just a list of things I had trouble remembering when switching from SAS to R. Heed the words of Brian D. 1.1 Bring raw numbers into R (05/22/2012) This is truly easy. myDataFrame <- read.table(‘‘myData’’,header=TRUE) If you type “? Suppose you have tab delimited data with blank spaces to indicate “missing” values. myDataFrame<-read.table("myData",sep="\t",na.strings=" ",header=TRUE) Be aware than anybody can choose his/her own separator. 1.2 Basic notation on data access (12/02/2012) or ?

Guide to Getting Started in Machine Learning Someone at work recently asked how he should go about studying machine learning on his own. So I’m putting together a little guide. This post will be a living document…I’ll keep adding to it, so please suggest additions and make comments. Fortunately, there’s a ton of great resources that are free and on the web. The very best way to get started that I can think of is to read chapter one of The Elements of Statistical Learning: Data Mining, Inference, and Prediction (2009 edition). The pdf is available online. Once you’ve read the first chapter, download R. Once you’ve installed R, maybe played around a little, then check out this page which describes the major machine learning packages in R. Oh, by the way, if you want to start playing around with machine learning in R, you’ll need data. I’d suggest next reading more of The Elements of Statistical Learning. Another great resource is the machine learning course MIT has posted on their OpenCourseWare site. I’ll stop here now.

Related: