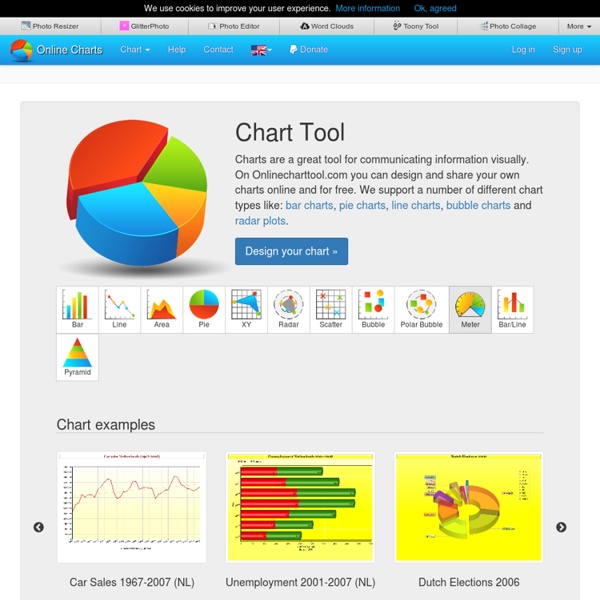


http://www.onlinecharttool.com/
Related: Data visualization, infografica, mindmapping • infographie • na temat infografikThe Best Data Visualization Projects of 2014 It's always tough to pick my favorite visualization projects. I mean, it's a challenge to pick and rank your favorite anything really. So much depends on what you feel like at the time, and there's a lot of good work out there. Nevertheless, I gave it a go. These are my favorites for the year, roughly in order of favorite on down and based on use of data, design, and being useful. Mostly though, my picks are based on gut. A List of The Best Free Digital Storytelling Tools for Teachers 1- ZimmerTwins It is all about creative storytelling. ZimmerTwins is a web2.0 tool that allows students to give vent to their imaginative powers and exercise their storytelling skills from early stages to advances ones. 2- Digital Story Telling in The Classroom This section provides resources and materials for teachers to use with their students in storytelling. It helps students personalize their learning and perform better.
Vitaly Friedman's Notebook: List of nifty tools for drawing diagrams, charts and flow-charts List of nifty tools for drawing diagrams, charts and flow-charts » Aug 18, 11:53 AM Update: The site is experiencing heavy load at the moment, please be patient. Meanwhile, you can digg the article, if you think it could be useful for other users. Being a web-developer means not only being able to design web-sites or program their functionality. Sometimes it also means to be able to explain complex issues clearly and be able to present to your potential customers reasonable and convincing arguments – in order to find the best compromise between the customer’s wishes and the standards you respect.
yEd - Graph Editor yEd is a powerful desktop application that can be used to quickly and effectively generate high-quality diagrams. Create diagrams manually, or import your external data for analysis. Our automatic layout algorithms arrange even large data sets with just the press of a button. yEd is freely available and runs on all major platforms: Windows, Unix/Linux, and Mac OS X. Gallery · mbostock/d3 Wiki Wiki ▸ Gallery Welcome to the D3 gallery! More examples are available for forking on Observable; see D3’s profile and the visualization collection. Please share your work on Observable, or tweet us a link! 4 Awesome New Blooms Taxonomy Posters I have been recently engaged in expanding Blooms Taxonomy section here in Educational Technology and Mobile Learning to include new resources published for the first time. Blooms Taxonomy for The iPad and Blooms Taxonomy for The Web are the most recent additions in this regard. I am also working on Blooms Taxonomy for Android.
Introduction XML/SWF Charts is a simple, yet powerful tool to create attractive charts and graphs from XML data. Create an XML source to describe a chart, then pass it to this tool's flash file to generate the chart. The XML source can be prepared manually, or generated dynamically using any scripting language (PHP, ASP, CFML, Perl, etc.) XML/SWF Charts makes the best of both the XML and SWF worlds.
Create Organizational Charts Online using Org Chart Software Org Chart Software Packed with Features Our org chart specific features like filtering makes it super easy to add/remove fields from your entire org chart in 1 click. This means you can do things like show telephone no to HR department while hiding the contact details to rest of the company in one single click. This helps you to maintain one org chart and show/hide details as necessary when distributing the org chart. At the moment we support name, position, location, department, telephone, email and gender.
10 Useful Flash Components for Graphing Data By Jacob Gube Flash is an excellent technology for dealing with data visualization. It being client-side, it can reduce the amount of work your server has to perform in order to generate graphs and charts. Because of its robust ability in dealing with sleek and fluid animation and complex user interactivity, Flash is an excellent web and (and even desktop) application technology for dealing with graphing data.
CSS Chart Generator - create CSS Charts on the fly! Below you can enter all the necessary information for your chart. The single items are explained and predefined, so you can simply start changing values. When you are done adding your values, simply click the send button and your chart will be generated in no time and you will receive a link which you can use to display the chart on your page.