

U.S. Chamber of Commerce Commercial Construction Index. Zarenski Construction Analytics - Various Indices. IHS MarkitPEG Engineering and Construction Cost Index (ECCI) The IHS Markit PEG Engineering and Construction Cost Index The IHS Markit PEG Engineering and Construction Cost Index (ECCI) is based upon data independently obtained and compiled by IHS Markit from procurement executives representing leading Engineering, Procurement, and Construction firms.
See full list of member companies. The ECCI tracks industry specific trends and variations, identifying market turning points for key projects, and is intended to act as a leading indicator for wage and material inflation specific to this construction and engineering industry. Surveys are sent out to members of the Procurement Executive Group (PEG) on the first Monday of each month and are open for a two week window. Results are released the last Friday of each month. ENR Construction Economics - Various Indices. Construction Economics ENR publishes both a Construction Cost Index and Building Cost index that are widely used in the construction industry.
This website contains an explanation of the indexes methodology and a complete history of the 20-city national average for the CCI and BCI. Both indexes have a materials and labor component. In the second issue of each month ENR publishes the CCI, BCI, materials index, skilled labor index and common labor index for 20 cities and the national average. The first issue also contains an index review of all five national indexes for the latest 14 month period. Construction Activity Index - Procore. Infrastructure Industries First, we looked at non-infrastructure projects vs. infrastructure projects.

Our goal was to see if the specific portions of the industry were responding differently. In early SIP Orders, Healthcare projects experienced significantly less activity reduction than other sectors, as well as less than other non-infrastructure projects. However, that narrative seems to be shifting as there appears to be a large decline in Heathcare worker hours. Energy, on the other hand, appeared to have a large decline in late April but looks to be not only recovering, but seeing somewhat of an acceleration in work well beyond the March benchmark. Transportation has been consistently down throughout the pandemic, more than most infrastructure sectors, but these declines appear to more closely follow the trajectory of non-infrastructure projects.Source: Procore application daily log, data subject to change as customers update data Download Full Metropolitan Report. Architecture Billings Index - AIA.
AIA’s monthly Architecture Billings Index (ABI) is a leading economic indicator for nonresidential construction activity, with a lead time of approximately 9–12 months.
The index is derived from AIA’s Work-on-the-Boards survey, which has gathered data on shifts in billings from architectural firm leaders for over 20 years. The resulting data provides a trusted tool for the design and construction industry and other firms to predict and track movements in the market. Market intelligence and analysis International investment groups, major media, small firms and business leaders alike rely on the ABI and other indicators drawn from AIA’s work-on-the-boards survey to assess business conditions.
Examples of the ABI in use Firm strategic planning ADD Inc., a multidisciplinary design firm with 200 employees, finds ABI a good indicator to help prepare for market fluctuations and ramp-up hiring. Determining business cycle shifts Timing in a changing economy. FMI Nonresidential Construction Index (NRCI) Housing Market Index (HMI) - NAHB. Interior Designs Billing Index - ASID. Dodge Momentum Index Monthly News Updates. Plant Cost Index - Chemical Engineering. Already a CEPCI subscriber?

Current customers login here: Get Chemical Engineering’s Plant Cost Index to Improve Plant Cost Estimates… and delivered online in advance of the print edition! Dear Chemical Engineering colleague, National Highway Construction Cost Index (NHCCI) Construction Cost Estimating Data Books. Subscribe to all 4 Construction Cost Indexes for and save!
The RSMeans Construction Cost Indexes are a means to compare costs from city to city, costs over time, and to localize the RSMeans national average construction costs. The publication contains indexes for 318 U.S. and Canadian cities as well as the national average index. The January issue also provides a historical listing of total indexes going back to 1940. Indexes are broken out by Material, Installation, and Total for each CSI division, as well as the total weighted average for that city. These are historical indexes with a base year of 1993. All the formulas to perform the adjustments are given with easy to follow examples. Construction Cost Index By City. Insight Chicago Construction Cost Index Download the complete report.
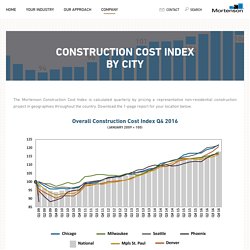
Madison's Lumber Reporter. Housing Market Index (HMI) The Housing Market Index (HMI) is based on a monthly survey of NAHB members designed to take the pulse of the single-family housing market.
The survey asks respondents to rate market conditions for the sale of new homes at the present time and in the next six months as well as the traffic of prospective buyers of new homes. Current Data Methodology The HMI is a weighted average of separate diffusion indices for these three key single-family series. The first two series are rated on a scale of Good, Fair and Poor and the last is rated on a scale of High/Very High, Average, and Low/Very Low.